
Figures & data
Figure 1. The increasing problem of paraquat poisoning deaths in Japan during the early 1980s. Adapted from Naito and Yamashita [Citation16].
![Figure 1. The increasing problem of paraquat poisoning deaths in Japan during the early 1980s. Adapted from Naito and Yamashita [Citation16].](/cms/asset/0e16a419-1e4b-4fef-916a-38fbf3024228/ictx_a_2064868_f0001_c.jpg)
Table 1. Registration status of OP and carbamate insecticides in Japan by WHO Hazard classes [Citation26].
Figure 2. Use of (A) OP and carbamate insecticides from 2000 to 2018 and (B) paraquat and diquat herbicides in Japan from 1966 to 2019.
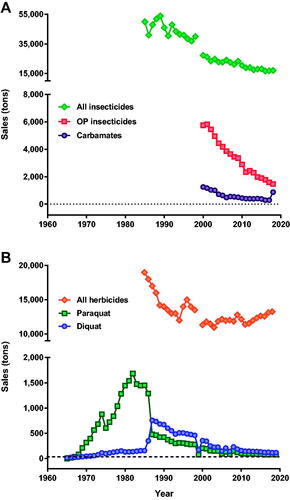
Figure 3. Deaths from pesticides in Japan 1968 to 2019. Source: Vital Statistics of Japan [Citation26].
![Figure 3. Deaths from pesticides in Japan 1968 to 2019. Source: Vital Statistics of Japan [Citation26].](/cms/asset/55974a1d-5b97-4c1e-9763-de2dabdbf24f/ictx_a_2064868_f0003_c.jpg)
Figure 4. Agricultural output in Japan from 1995 to 2016 for selected paddy, vegetable and orchard crops (source FAOStat; http://www.fao.org/faostat/en/#data/QC).
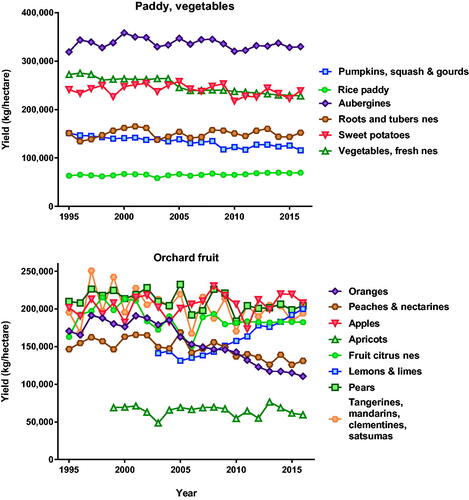
Figure 5. Trends in the sale of paraquat and number of deaths by non-OP/carbamate insecticides poisoning in Japan, 1979–2019.
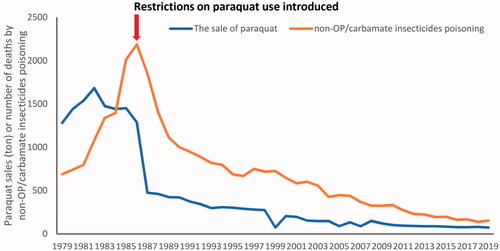
Table 2. Prais-Winsten regression analyses of the associations between pesticide sale or use (kiloton) and mortality rate per 1,000,000 in Japan.