
Figures & data
Table 1. Characteristics of European Poison Control Centres (PCCs) in this study.
Table 2. Changes in the number of calls to European Poison Control Centres (PCCs) in 2020 vs. 2018/2019: grouped by PCCs with increasing or decreasing calls.
Figure 1. Change in calls to European Poison Control Centres in 2020 vs. 2018/2019. The monthly number of calls to all PCCs/countries (26 datasheets) in 2020 was summed. For 2018/2019, the monthly number of calls in 2018 and the monthly number of calls in 2019 were averaged per PCC/country, and subsequently summed for all PCCs/countries (26 datasheets). Note that UK and France supplied nationwide data representing >1 PCC. *The number of calls (summed data) was significantly higher in 2020 compared to 2018/19 (p < 0.0005, χ2 test).
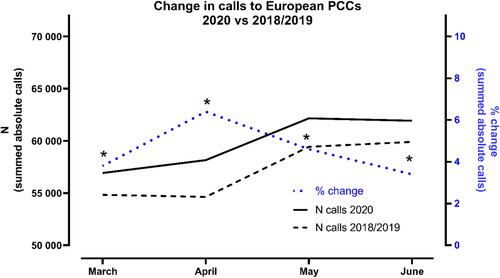
Figure 2. Change in calls within European Poison Control Centres or countries in 2020 vs. 2018/2019 and COVID-19 cases in 2020 per country. The monthly number of calls in 2018 and the monthly number of calls in 2019 were averaged per PCC/country. For each PCC/country, the monthly number of calls in 2020 was expressed relative to the average monthly number of calls in 2018 and 2019 (represented by 0% effect). For better visualisation, PCCs are grouped according to the number of calls from March to June 2020 in (A) <1000, (C) 1000–10,000 and (E) >10,000 calls. Note the different y-axes and that UK and France supplied nationwide data representing ≥1 PCC. B, D and F represent COVID-19 cases during the study period (March–June) per 100,000 inhabitants per country (cumulative number for 14 d, ECDC). Correlation between change in calls and the number of COVID-19 cases in the same month is listed for all PCCs/countries (R = Spearman’s rho, N = 4 XY pairs (March, April, June, and July)). For a colour version, please read online.
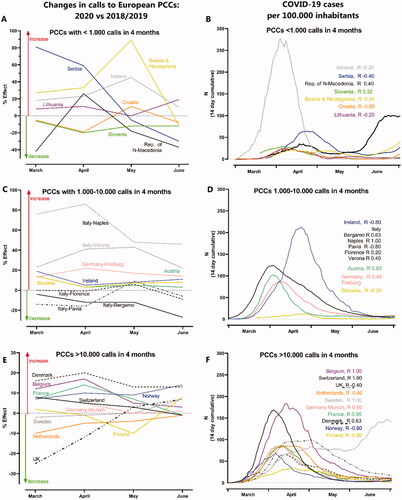
Figure 3. Median proportion of reasons of exposure (A) and age groups (B) of calls to European Poison Control Centres or countries in 2020 vs. 2018/2019. *The median proportion of calls (grouped data) was significantly higher in 2020 compared to 2018/19 (p < 0.0005, χ2 test). For deviations in data supply regarding age groups, see Supplemental Material 1.2.
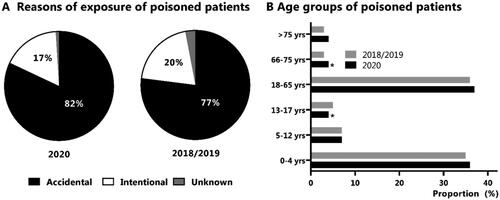
Table 3. Median proportion of calls on specific exposures to European Poison Control Centres (PCCs) in 2018/19 and 2020.
Table 4. PCC workload related to COVID-19 incidence.