
Figures & data
Figure 1. Demographics of patients presenting to ED for acute drug toxicity. Histogram labels contain absolute number of ED presentations involving at least one NPS (percentage of all drug-related ED presentations). All centres reporting data were included. NR: not recorded; NPS: novel psychoactive substance; ED: emergency department.
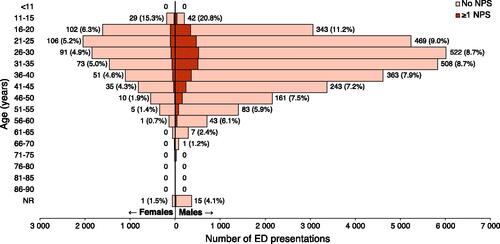
Figure 2. Number of presentations to ED for acute drug toxicity by year. Histogram labels contain absolute number of ED presentations involving at least one NPS (percentage of all drug-related ED presentations). Only centres reporting data for all 6 years were included. NPS: novel psychoactive substance; ED: emergency department.
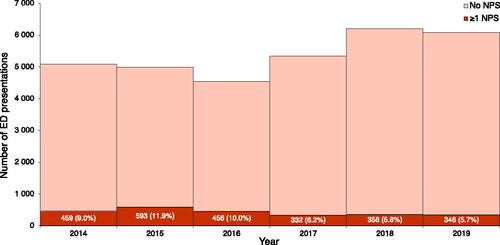
Figure 3. Number of NPS agents leading to ED presentations for acute drug toxicity reported by year. Histogram labels contain absolute number of NPS agents reported by year representing a specific subgroup (percentage of all NPS agents leading to ED presentations for acute drug toxicity). NPS denotes novel psychoactive substance, SC synthetic cannabinoids, ED: emergency department; “Other NPS” include: arylalkylamine, arylcyclohexylamine, indolalkylamine (tryptamine), novel benzodiazepine, novel opioid, phenylethylamine, piperazine, piperidine, plant, tryptamine, unknown or “branded” NPS. A: Centres reporting data for all 6 years only. B: Centres reporting data for all 6 years only, excluding St Thomas’ Hospital in London, UK. C: St Thomas’ Hospital in London, UK only.
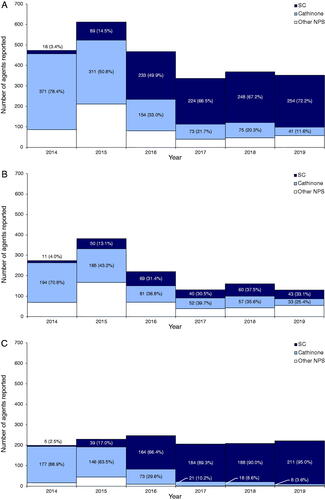
Figure 4. A: Number of presentations to ED for acute drug toxicity by centre. Histogram labels contain absolute number of ED presentations involving at least one NPS (percentage of all drug-related ED presentations). All centres reporting data were included and are labelled as country-city (centre). NPS: novel psychoactive substance; ED: emergency department; OUH: Oslo University Hospital; OAEOC: Oslo Accident and Emergency Outpatient Clinic; KCH: King’s College Hospital; STH: St Thomas’ Hospital. B: Number of NPS agents leading to ED presentations for acute drug toxicity reported by centre. Histogram labels contain the percentage of all NPS agents leading to ED presentations for acute drug toxicity reported by centre representing a specific subgroup (O) for “other NPS”, (C) for “cathinone” and (S) for “SC”. All centres reporting data were included and are labelled as country-city (centre). NPS: novel psychoactive substance; SC: synthetic cannabinoids; ED: emergency department; OUH: Oslo University Hospital; OAEOC: Oslo Accident and Emergency Outpatient Clinic; KCH: King’s College Hospital; STH: St Thomas’ Hospital.
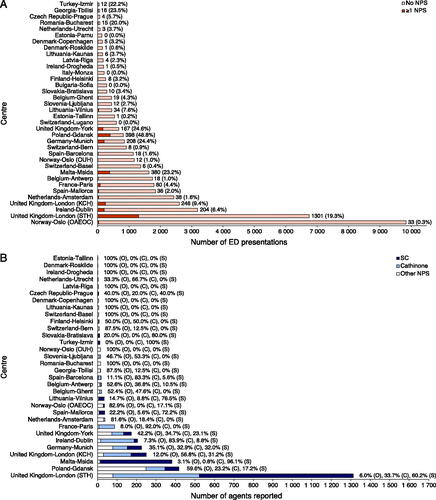
Figure 5. Other agents most commonly reported in presentations to ED for acute drug toxicity involving at least one NPS. Histogram labels contain the percentage of presentations leading to ED presentations for acute NPS toxicity involving agents of each class. All centres reporting data were included. NPS: novel psychoactive substance; SC: synthetic cannabinoids; ED: emergency department. Agents were grouped as follows: ketamine (ketamine and esketamine); amphetamine (amphetamine); benzodiazepine (alprazolam, clonazepam, diazepam, etizolam, flurazepam, nitrazepam, oxazepam, and unknown benzodiazepine); MD*A (methylenedioxymethamphetamine, methylenedioxyamphetamine, and methylenedioxyethylamphetamine); heroin (heroin); opioid (buprenorphine, codeine, fentanyl, levomethadone, methadone, morphine, oxycodone, tramadol, unknown opioid); methamphetamine (methamphetamine); cannabis (cannabis and cannabidiol); cocaine (cocaine and crack cocaine); GHB (gamma-hydroxybutyric acid and gamma-butyrolactone); ethanol (ethanol). Note: co-ingestion of ethanol was not reported for 27.7% of all presentations involving at least one NPS.
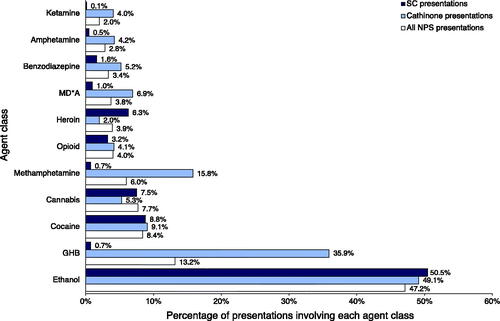
Figure 6. Length of hospital stays for presentations. Length of hospital stay is defined as the time from presentation to the emergency department to discharge from the hospital. In-hospital deaths were censored. All centres reporting data were included. NPS denotes novel psychoactive substance.
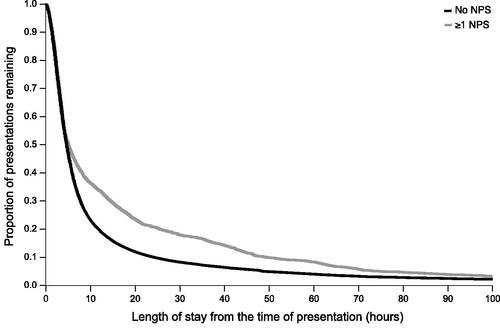
Table 1. Patient outcomes.