Figures & data
Figure 1. Schematic architecture of ToxNet. The symptom vectors are processed in the graph-based GAT layers and the literature-matching network in parallel. The upper branch is the literature branch, and the lower branch is the GAT branch. GAT: graph attention layer; FC: fully connected layer; GT: ground truth; S: symptom vector; G: graph containing symptoms and metadata; M: number of patients.
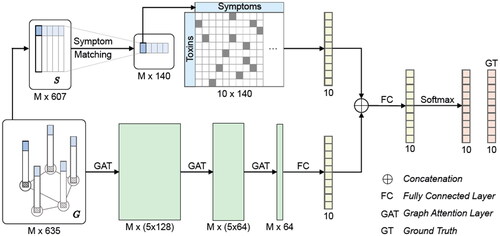
Table 1. Included substances in pilot and extended cohort with number of cases with respective F1 score of ToxNet.
Figure 2. Comparison of ToxNet in different settings compared with the GAT branch over 10-fold cross-validation in the pilot cohort, 8995 cases. GAT: graph attention network; ToxNet(S): ToxNet in sequential setting; ToxNet: ToxNet in parallel setting.
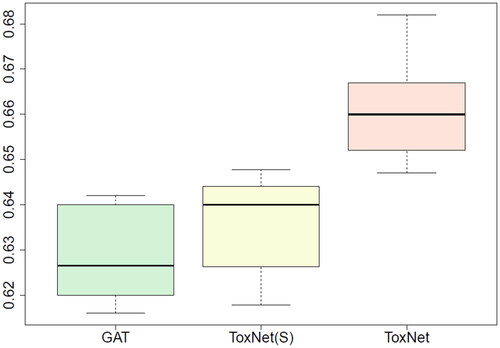
Figure 3. Comparison of MDs’ performance with ToxNet over 10 different sets evaluated by one MD each set (25 cases per set) in the pilot cohort, overall 250 cases. MDs: medical doctors; GAT: graph attention network; ToxNet(S): ToxNet in sequential setting; ToxNet: ToxNet in parallel setting.
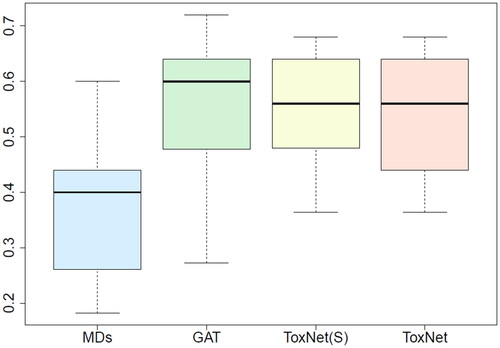
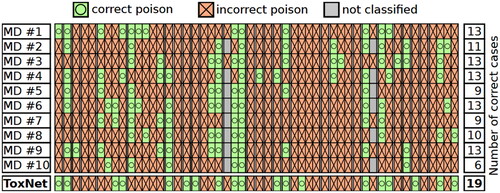
Figure 4. Clinician inter-variability and comparison with ToxNet. Poison classes are ordered alphabetically, each group separated with a white spacing in the pilot cohort, 25 cases.
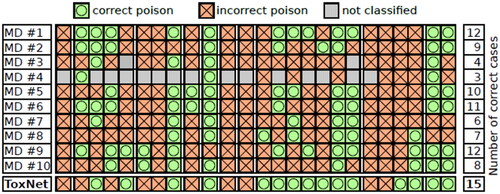
Figure 5. Comparison of ToxNet with MLP and the GAT branch over 10-fold cross-validation in the extended cohort, 36,033 cases. MLP: multi-layer perceptron; GAT: graph attention network; ToxNet: ToxNet in parallel setting.
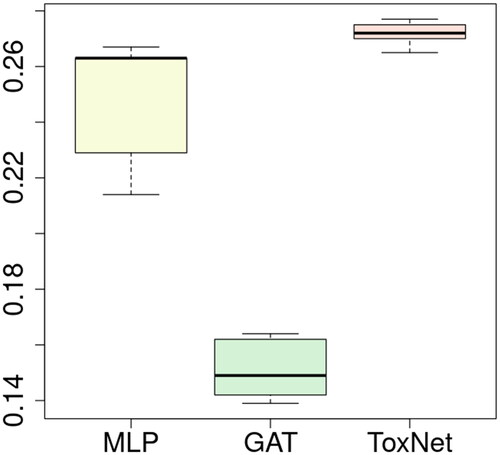
Figure 6. Comparison of MDs’ performance with ToxNet over 10 different sets evaluated by one MD each set (50 cases per set) in the extended cohort, overall 500 cases. MDs: medical doctors; GAT: graph attention network; ToxNet: ToxNet in parallel setting.
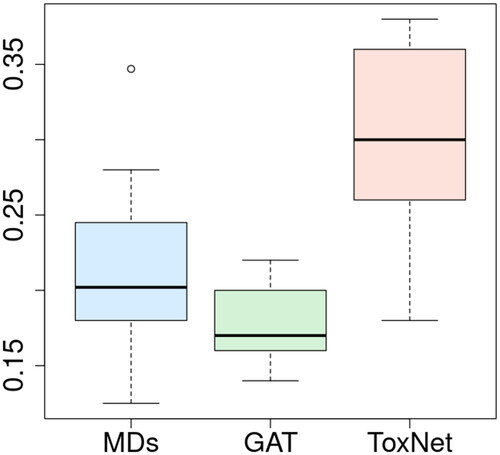
Figure 7. Clinician inter-variability and comparison with ToxNet. Poison classes are ordered alphabetically, each group separated with a white spacing in the extended cohort, 50 cases.