
Figures & data
Figure 1. Flow diagram for patients included in the study.
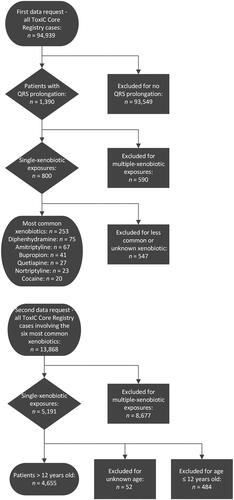
Table 1. The demographics of patients in the study cohort who met inclusion criteria.
Figure 2. Odds ratios for clinical outcomes in patients with prolonged QRS complex compared to a normal QRS complex duration. Columns with no bar and an asterisk (*) signify an odds ratio where the 95% confidence interval did not show a significant difference in outcomes between patients with a prolonged compared to normal QRS complex duration. The error bars display the 95% confidence interval for each odds ratio, which may also be seen in .
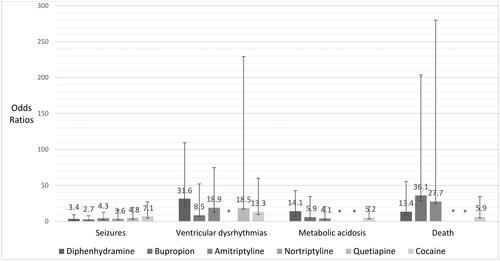
Table 2. Statistical analyses for patients with normal and prolonged QRS complex durations for developing seizures.
Table 3. Statistical analyses for patients with normal and prolonged QRS complex durations for developing ventricular dysrhythmias.
Table 4. Statistical analyses for patients with normal and prolonged QRS complex durations for developing metabolic acidosis.
Table 5. Statistical analyses for patients with normal and prolonged QRS interval durations for deaths.
Data availability statement
Data for this manuscript was obtained by request from the American College of Medical Toxicology’s Toxicology Investigators Consortium: https://www.acmt.net/toxic/