Figures & data
Figure 1. Total number of chlorpromazine overdose presentations by year from 1987 to 2023, and number of these intubated (light blue) or not intubated (dark blue) each year.
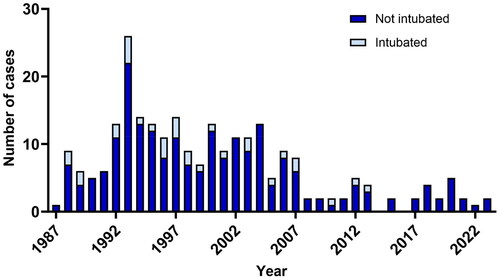
Figure 2. Number of first generation antipsychotic overdose presentations by year from 1987 to 2021. Chlorpromazine (blue), haloperidol (green), thioridazine (red) and other first generation antipsychotics (trifluoperazine, fluphenazine, pimozide; orange).
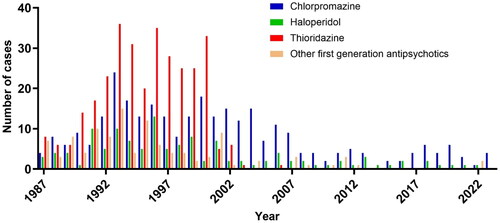
Table 1. Severity of effects and outcome differences between all 218 chlorpromazine overdose cases, chlorpromazine alone ingestions, chlorpromazine overdoses with co-ingestions, requiring intensive care unit care and endotracheal intubation or not.
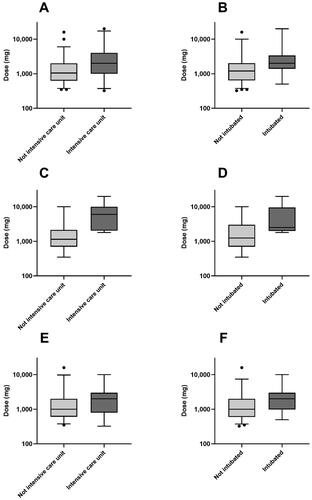
Figure 3. Graphs (box and whiskers) of reported doses ingested (logarithmic scale) in all chlorpromazine overdoses (A, B), chlorpromazine alone ingestions (C, D) and chlorpromazine overdoses with co-ingestions (E, F), among patients admitted to intensive care unit or not (A, C, E) and intubated or not (B, D, F). Horizontal lines demonstrate medians, with the box representing the interquartile range and the whiskers representing the 2.5 percentile (lower) and the 97.5 percentile (upper).