Figures & data
Fig. 1. Oxalate crystals deposit within the renal tubules. (A) These deposits are laminated (in black) and (B) birefringent under polarized light (H&E x40); (C) visualization of the oxalate crystals deposits with confocal laser scanning microscope; (D) tubular epithelial cells with cytoplasmic swelling and acute necrosis; (E) birefringent crystals in the renal tubules; (F) scan for interstitial connective and (G) definitive evidence of calcium oxalate crystals within the renal tubules (in white); interstitial connective in green, erythrocytes in yellow and epithelial nuclei in red.
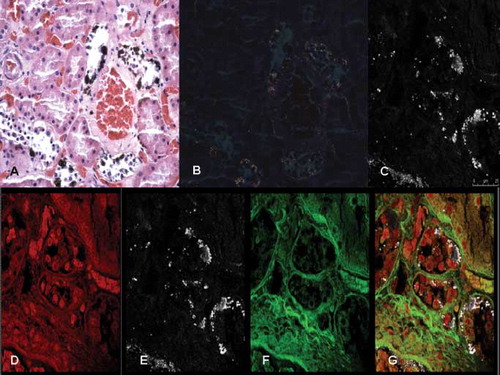
Fig. 2. Confocal laser scanning microscopy study of the kidneys. (A) Oxalate crystals deposition within the tubular epithelial cells: widespread necrosis of the tubular epithelium in the proximal tubules; (B) and (C) high magnification (inserts) of the oxalate crystals deposition in a 3-D view; and (D) 3-D reconstruction of oxalate crystals (in pink) and the same image (insert) obtained from the z-lines cut surface.
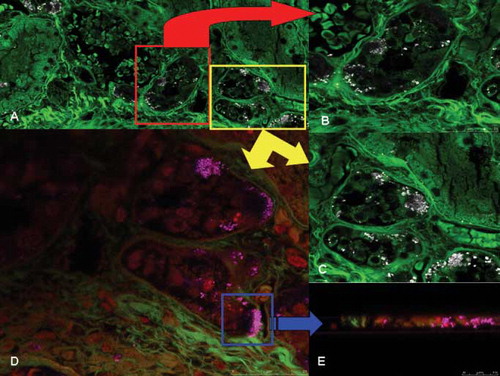
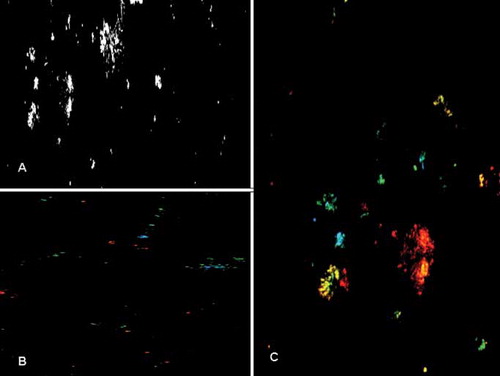
Fig. 3. Calcium oxalate crystals in urine observed under confocal laser scanning microscope. (A) Needle-like appearance of calcium oxalate crystals. Monohydrate crystals are visualized (B) in green and blue colors under different laser beams; and (C) dihydrate crystals with the characteristic symmetrical mussel-shaped appearance are visualized in red and yellow.