Figures & data
Figure 1 Maps showing the location of Kisar Island and HSE site, and its proximity to neighboring islands. A) Dark gray indicates reconstructed sea levels at c. 15 ka. B) Distance (km) from Kisar to its nearest neighbors for present day (small values), and ca. 15 ka (larger values).
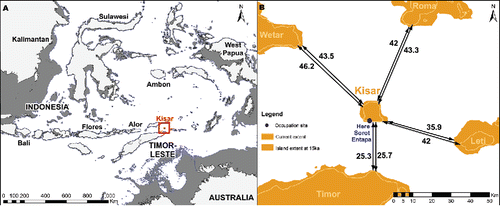
Figure 2 Profile of HSE ridgeline down to coast showing height above coast and distance to coast.
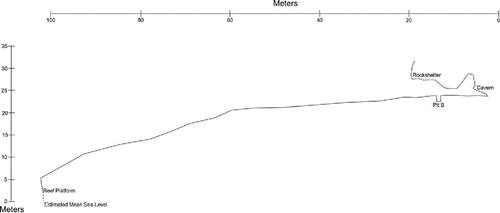
Figure 3 Plan of the HSE shelter and cave with excavation squares indicated in yellow and large rocks/boulders in blue.
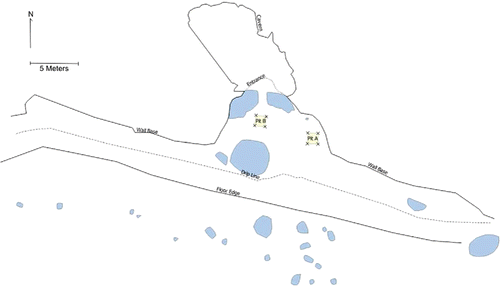
Figure 4 Stratigraphy of HSE, Square A (above) and Square B (below). Stratigraphic units numbered within the image, spits numbered down the vertical axis.
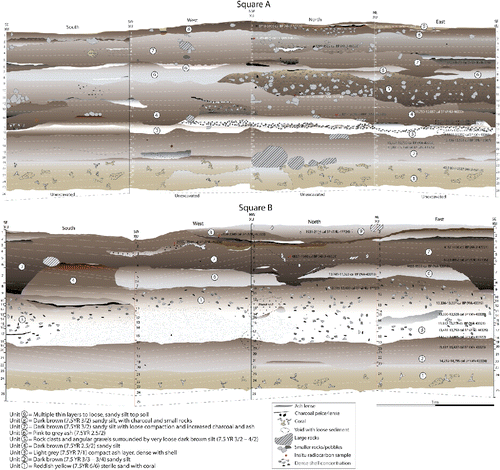
Table 1. Radiocarbon samples analyzed from squares (Sq.) A and B, HSE. ANU = The Australian National University Radiocarbon Dating Laboratory. Wk = The University of Waikato Radiocarbon Dating Laboratory. Calibrated and modelled in OxCal v.4.3 (Ramsey Citation2009a) using the IntCal13 (for charcoal) and Marine13 (for shells) calibration curves (Reimer et al. Citation2013). Unmodelled and modelled calibrated dates are all shown at 95.4% posterior probability. Units and spits correspond to the stratigraphy (see ), Phase 1 is shaded purple, Phase 2 is orange. Modelled dates are shown in .
Figure 5 Bayesian model of radiocarbon dates from HSE. Modeled in OxCal v.4.3 (Ramsey Citation2009a) using the IntCal13 (for charcoal) and Marine13 (for shells) calibration curves (Reimer et al. Citation2013). Units correspond to and . Black probability distributions represent the modeled date (with 95.4% probability range bracketed underneath), while the pale distributions represent areas where the unmodeled, calibrated date does not overlap with the model. Sample codes are written thus: Square_Radiocarbon Laboratory_Individual Sample Number; and correspond to . Prior and posterior outlier probabilities follow in square brackets as follows: [O:posterior/prior].
![Figure 5 Bayesian model of radiocarbon dates from HSE. Modeled in OxCal v.4.3 (Ramsey Citation2009a) using the IntCal13 (for charcoal) and Marine13 (for shells) calibration curves (Reimer et al. Citation2013). Units correspond to Figure 4 and Table 1. Black probability distributions represent the modeled date (with 95.4% probability range bracketed underneath), while the pale distributions represent areas where the unmodeled, calibrated date does not overlap with the model. Sample codes are written thus: Square_Radiocarbon Laboratory_Individual Sample Number; and correspond to Table 1. Prior and posterior outlier probabilities follow in square brackets as follows: [O:posterior/prior].](/cms/asset/863cb138-16fe-4ffd-b1e7-7194c66efa9b/uica_a_1443171_f0005_c.gif)
Figure 6 Lithics histograms. Artifact frequencies: A) Square A TNA and MNF values, B) Square B TNA and MNF values. Raw material types: C) Square A, D) Square B.
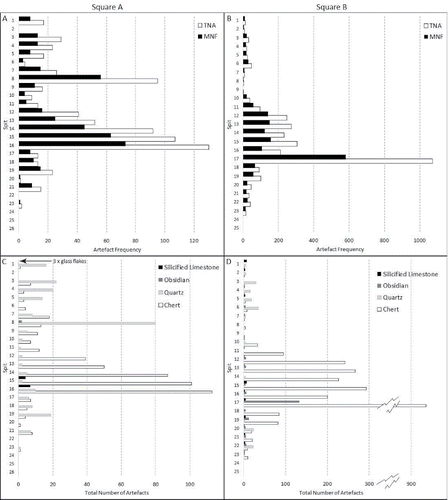
Table 2. Stratigraphic distribution of fishhooks and shell beads. Square A first, shaded blue, followed by Square B shaded pink.
Figure 7 Shell and bone tools from HSE. A) Nautilus pendant with thick red ochre residue from Square B Spit 12; B) bone point from Square B Spit 17; C–D) Tectus fishhooks from Square B Spit 13; E) Tectus fishhook from Square B Spit 10; F–G) fragments of Nautilus two-holed beads from Square A Spit 7; H) Nautilus disc bead from Square A Spit 1 I) Detail of perforations on Nautilus pendant, scale bar = 1 mm; J) working tip on bone tool, scale bar = 1 mm (Photos MCL).
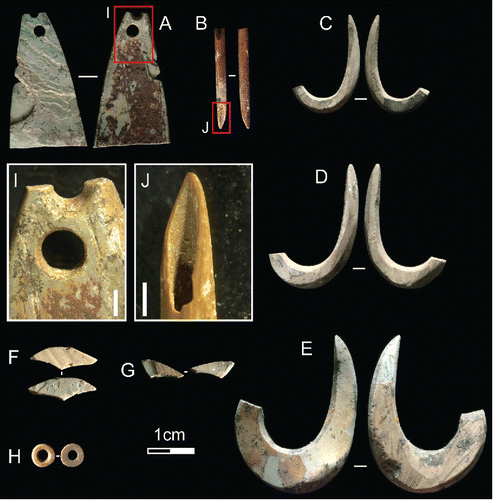
Figure 8 Coral tool from Square B Spit 6. A) Worked edge with facetted tip; B) chipping, rounding, and minuscule ochre residues (indicated by red arrow) on working edge; C) group of parallel striations near working edge; D) rounding and polish of coral surface. Scale bars = 1 mm. (Photos MCL).
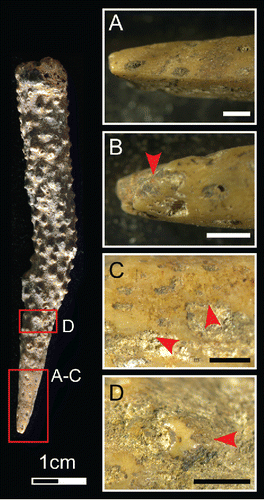
Figure 9 Faunal Histograms for Square A, all faunal abundance by weight (g) per spit.
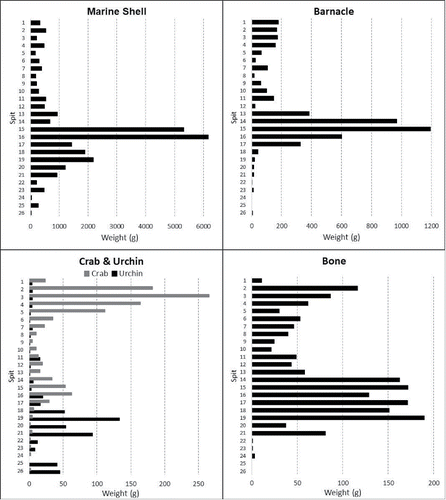
Figure 10 Faunal Histograms for Square B, invertebrate abundance by weight (g) per spit, vertebrate abundance by NISP.
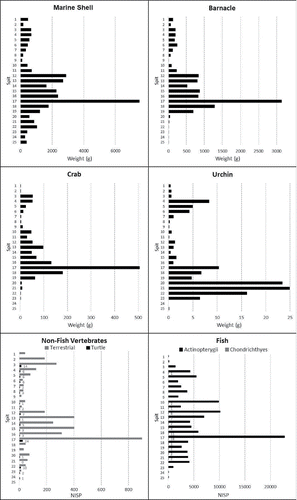
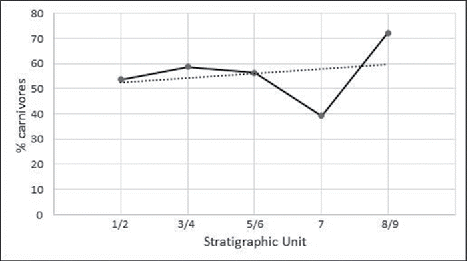
Figure 11 Temporal changes in fishing practice at Here Sorot Entapa as represented by the proportions of carnivores relative to herbivores and omnivores {(Carnivore NISP/Herbivore NISP + Omnivore NISP) × 100} by temporal phase after Butler (Citation1994).