Figures & data
Figure 1. Population growth scenarios (adapted from Kirch Citation1984).
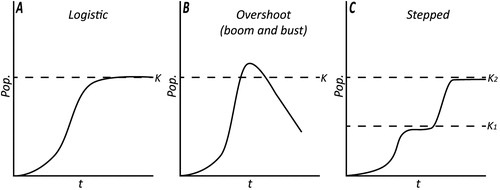
Figure 2. Distribution of sites yielding radiocarbon dates for this analysis and the three economic sub-regions of New Zealand used in this analysis.
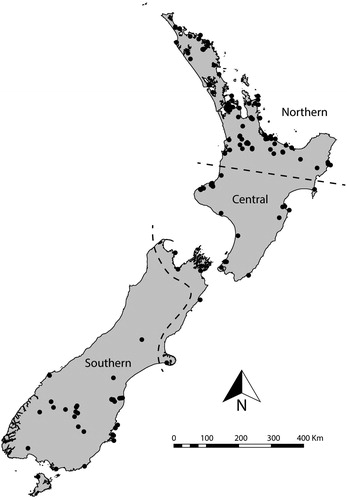
Table 1. Breakdown of radiocarbon dates and “bins” used in this analysis.
Figure 3. Model tests showing the similarity between observed data and fitted logistic models of growth. Observed SPDRD for each region shown with a solid black line, fitted null model (logistic growth) shown with the red dashed line, gray areas represent the confidence envelope derived from the null model. Red and blue bands represent areas where the observed SPD significantly deviates from the null model (e.g., red areas are those where regional population exceeds the expectations of the null, blue areas are those where population is beneath expectations).
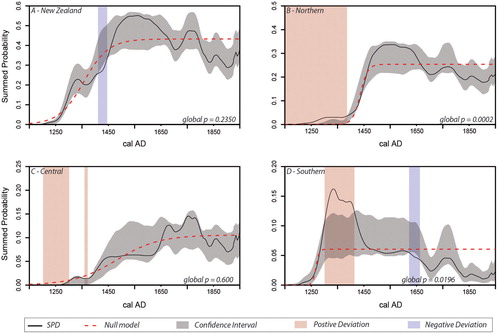
Figure 4. Permutation tests showing variation between regional population growth. Observed SPDRD for each region shown with a solid black line. Gray areas represent the confidence envelope for the null model, red and blue bands represent areas where the observed SPD significantly deviates from the null model (e.g. red areas are those where regional population exceeds the expectations of the null, blue areas are those where population is beneath expectations).
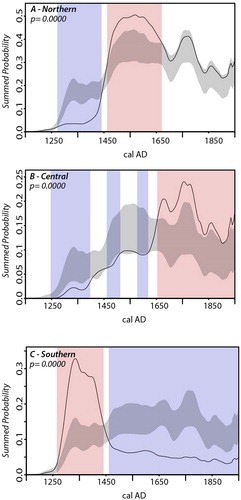
Figure 5. A, the observed SPDRD for New Zealand (thin black line) with a 50-year rolling mean (thick black line) showing the growth trajectory across each of the transitions (I-V). B, observed rate of growth at each transition computed from the SPDRD in A.
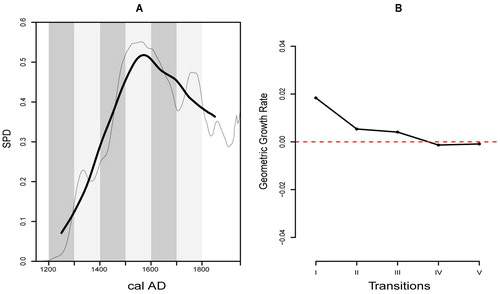
Figure 6. Local geometric growth rate for each transition.
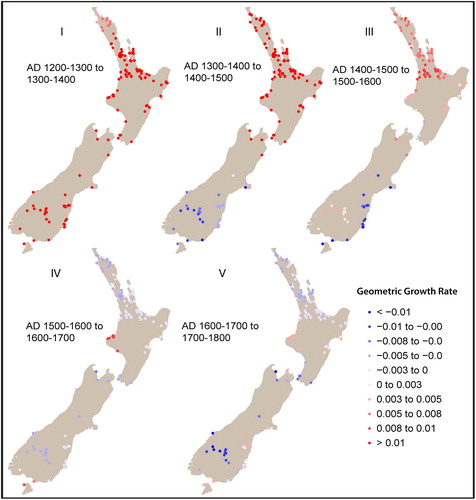
Figure 7. Spatial permutation test showing areas where growth is significantly higher or lower than the null. Significance is shown in terms of q-values (more robust against false positives) and p-values.
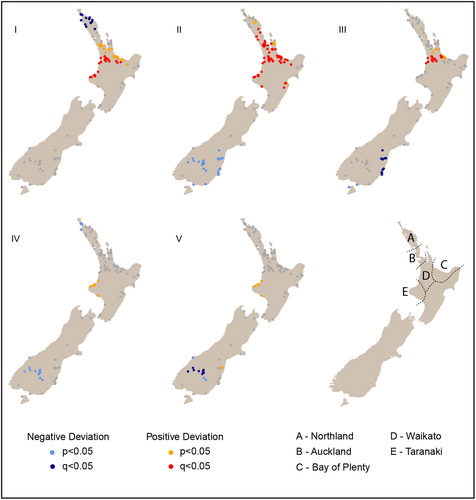
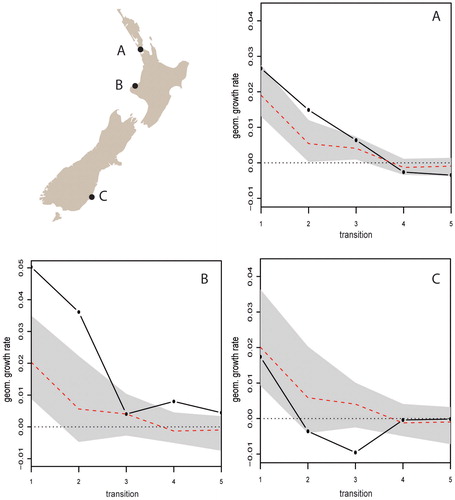
Figure 8. Observed geometric growth rates at three locations in New Zealand. Where growth at a transition falls outside the gray confidence envelope it is regarded as a significant local deviation from the null.