Figures & data
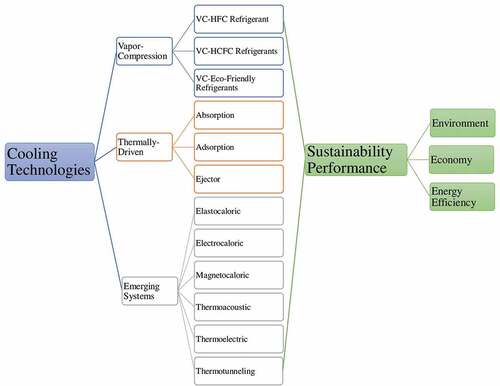
Figure 1. Investigated cooling systems.
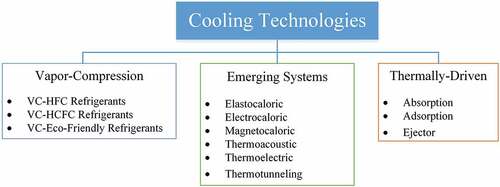
Figure 2. Basic vapor-compression cooling system schematic diagram.
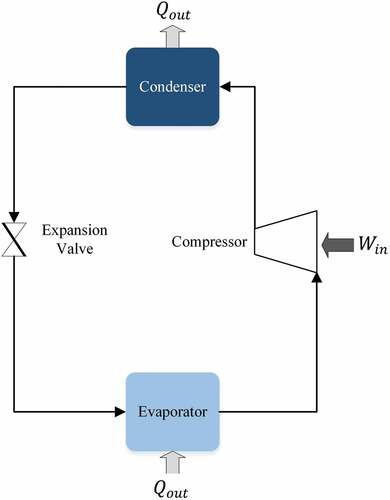
Figure 3. Basic absorption cooling system schematic diagram.
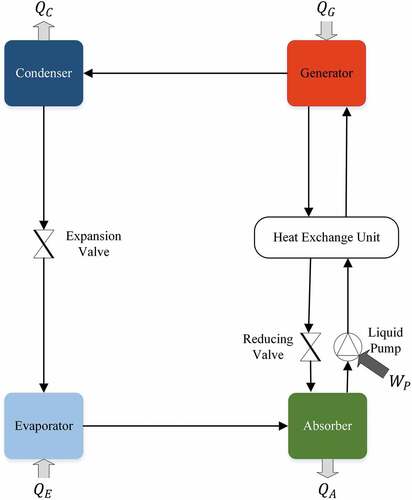
Figure 4. Adsorption cooling system schematic diagram.
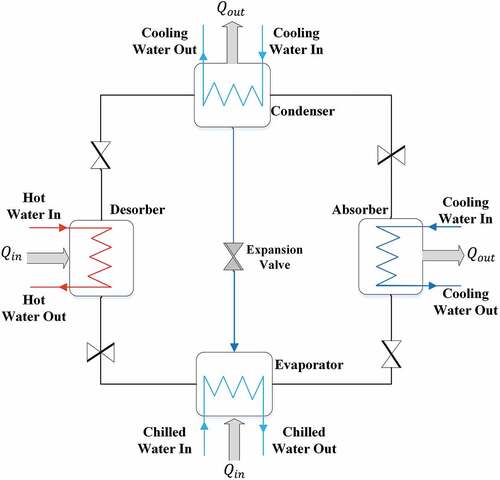
Figure 5. Ejector cooling system schematic diagram.
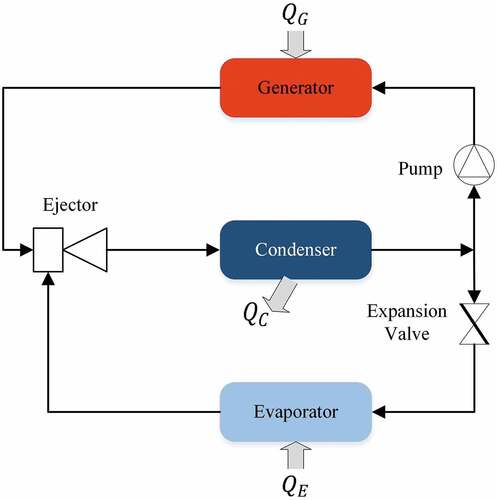
Figure 6. Elastocaloric regenerator cycle.
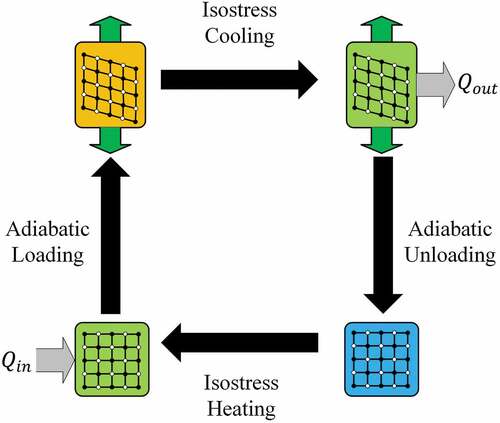
Figure 7. Electrocaloric regenerator cycle.
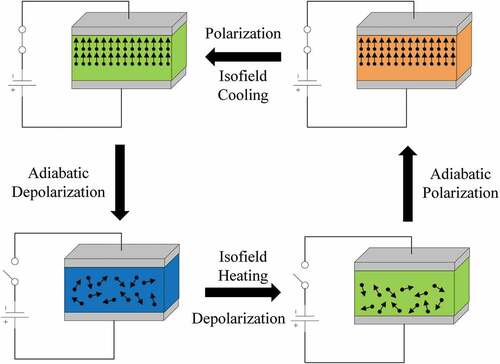
Figure 8. Magnetocaloric regenerator cycle.
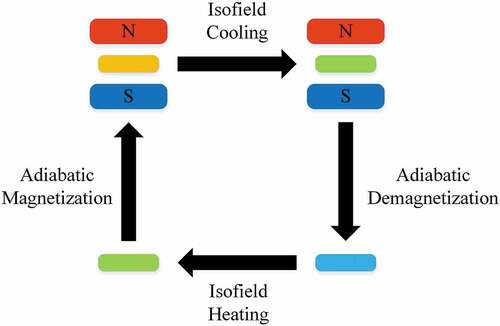
Figure 9. Thermoacoustic refrigerator (left) standing wave (right) traveling wave.
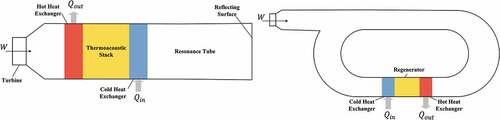
Figure 10. Thermoelectric cooling system.
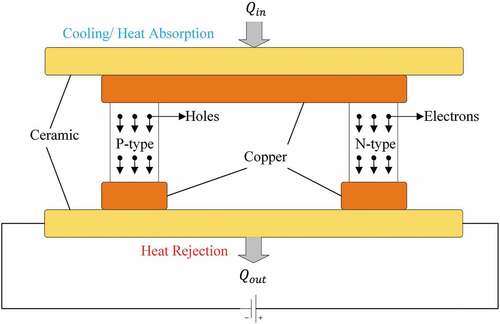
Figure 11. Thermionic cooling system.
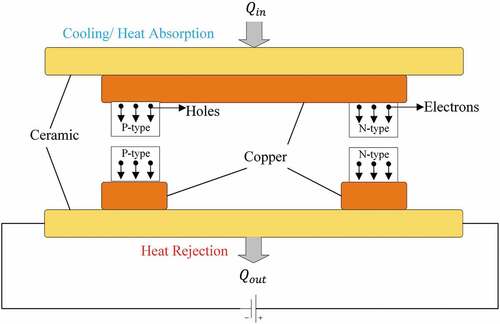
Table 1. Main pros and cons of cooling cycles.
Table 2. Cooling technology sustainability parameters’ scale.
Table 3. Sustainability score perspective weighting schemes.
Figure 12. Sustainability performance of the investigated cooling cycles for different weighting schemes.
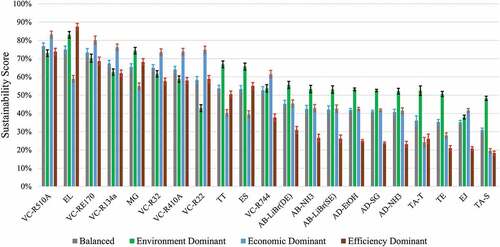
Table 4. Sustainability comparison of investigated cooling technologies (balanced).
Figure 13. Cooling COP impact on the overall sustainability score of the different investigated cooling systems’ categories.
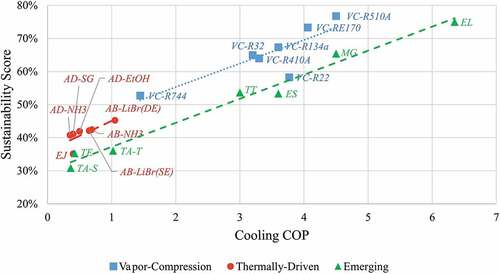
Figure 14. Cost of cooling operation impact on the overall sustainability score of the different investigated cooling systems’ categories.
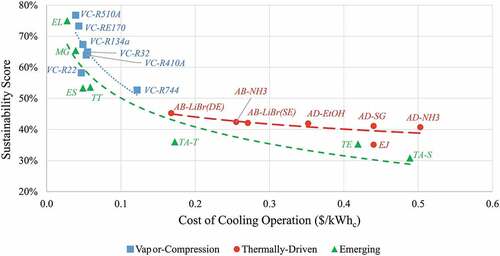
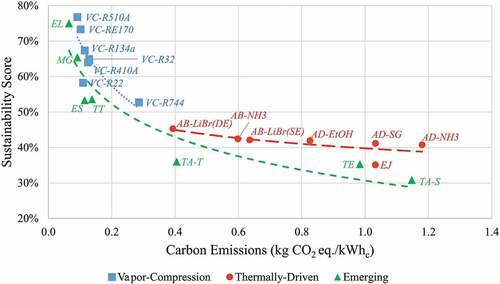
Figure 15. Carbon emissions impact on the overall sustainability score of the different investigated cooling systems’ categories.