
Figures & data
Table 1. Single dimensions of energy poverty.
Table 2. Cross-correlations and redundancy measures (%) of single dimensions of energy poverty in Poland.
Table 3. Coincidence of single dimensions of energy poverty.
Figure 1. Energy poverty rate according to the multi-dimensional and single indicators (percent of households, with standard errors).
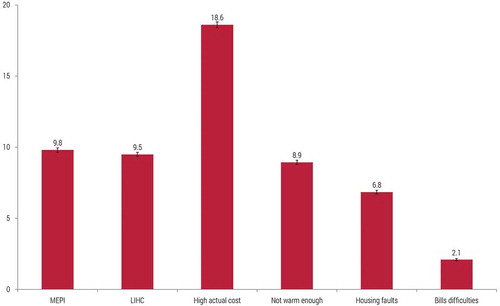
Table 4. Energy-poor households, by dimensions of the poverty.
Figure 2. Equivalised income of households – overall and for energy-poor households (multi-dimensionally and according to single indicators).
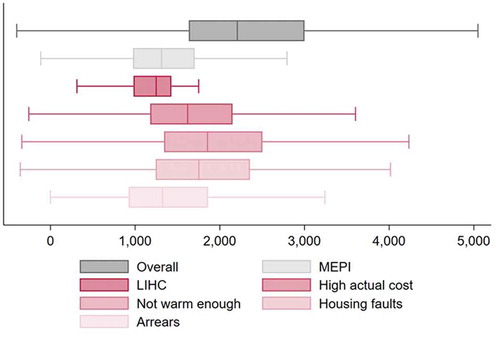
Figure 3. Income poverty among energy-poor households (multi-dimensionally and according to single indicators).
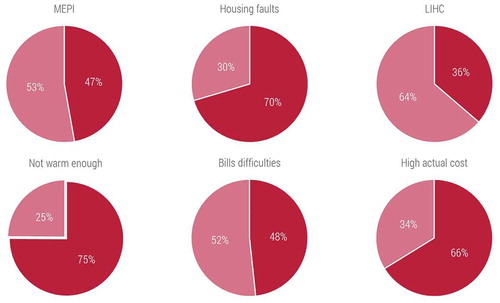
Figure 4. Multidimensional energy poverty index and single dimensions of energy poverty, by main source of household income (percent of households).
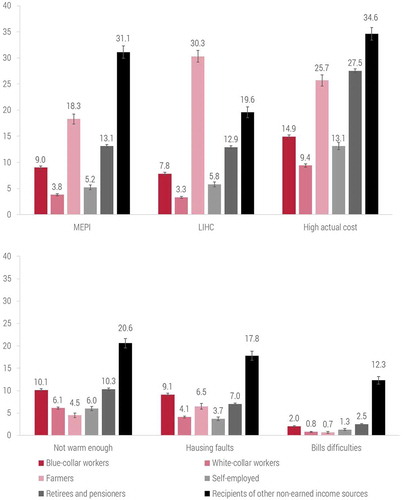
Figure 5. Multidimensional energy poverty index and single dimensions of energy poverty (percent of households), by type of building.
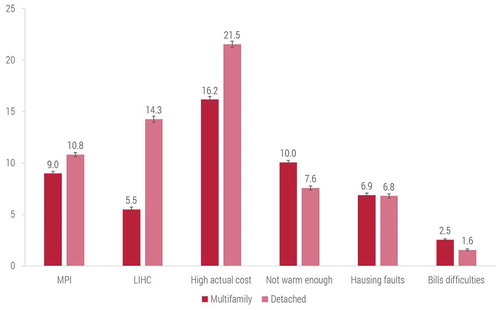
Figure 6. Multidimensional energy poverty index and single dimensions of energy poverty (percent of households), by year of construction and type of building.
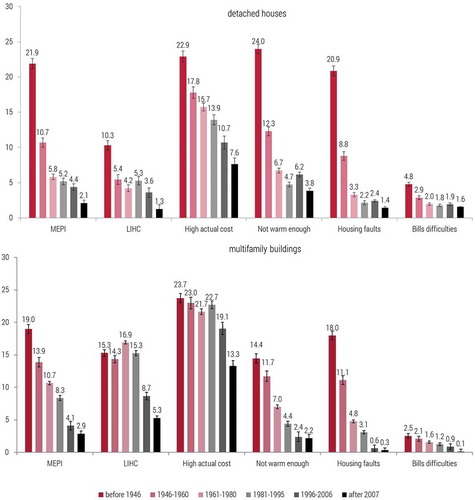
Table 5. Energy-poor households, by dimensions of the form of poverty.
Table 6. Structure of energy-poor households, by type of building and year of construction (thousands of households).
Figure 7. Multidimensional energy poverty index and single dimensions of energy poverty (percent of households), by size of place of residence.
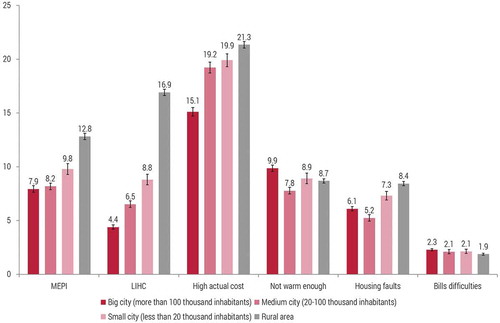
Table 7. Structure of energy-poor households by size of place of residence (thousands of households).
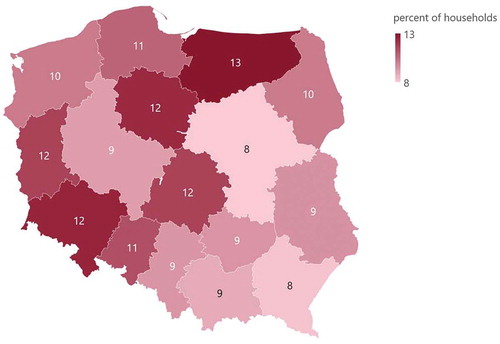
Map 1. Multidimensional energy poverty rate by NUTS2 regions in Poland (percent of households).
Map 2. The distribution of the multidimensional energy poverty rate by NUTS2 regions in Poland (thousands of households).
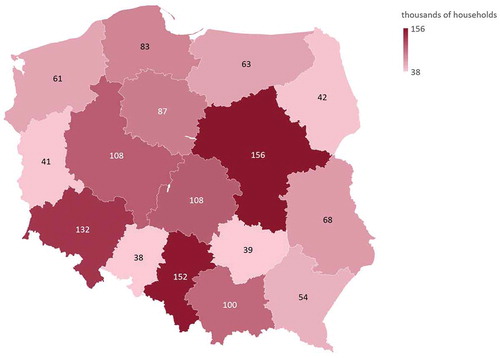
Table 8. The headcount, adjusted headcount, and deprivation intensity, by main source of incomeFootnote8