
Figures & data
Table 1. Summary of reviewed studies.
Table 2. Descriptive statistics of the variables.
Table 3. Significance test for TVCs.
Table 4. Long-run estimation results.
Figure 1. Plots of variables.
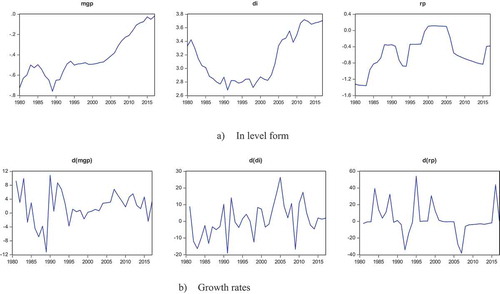
Figure 2. Time-varying income elasticity.
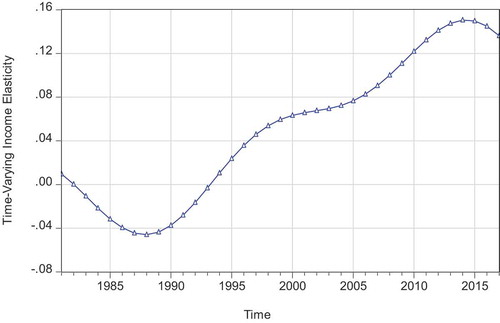
Figure 3. Time-varying price elasticity.
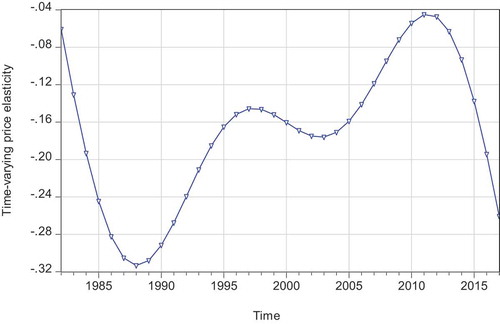
Figure 4. Comparison of income elasticity in different periods, with per capita income and government transfers (normalized scale).
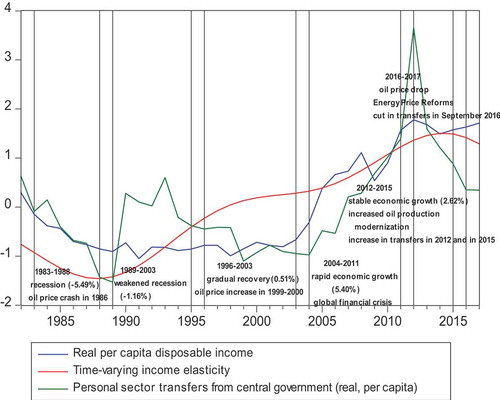
Figure 5. Time-varying price elasticity and gasoline price (normalized scale).
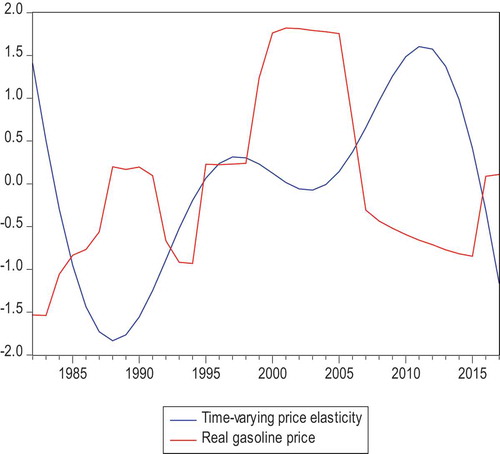
Figure 1A. Plots of (a) recursive residuals, (b) CUSUM and (c) CUSUM of squares tests for stability.
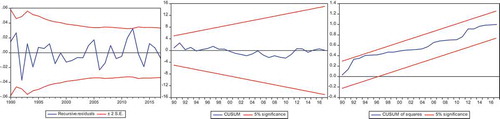
Table 1A. The ADF unit root test results.
Table 2A. Cointegration test results.
Table 3A. Short-run final specification.