
Figures & data
Figure 1. Yearly growth of cumulative installed capacity (own elaboration based on IRENA (Citation2019a) and CSP.guru (Citation2020))
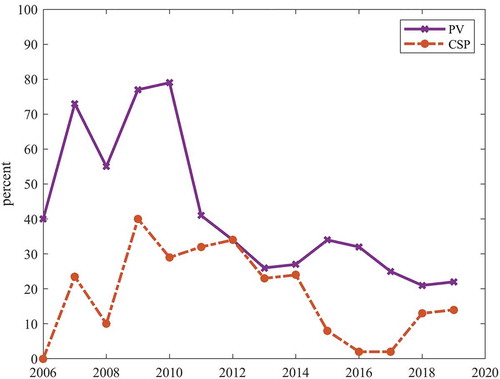
Figure 2. Conceptualization of PV combined with battery storage and CSP (solar field, receiver, thermal energy storage, and power block). Power flow in direct current (DC) and alternating current (AC). Solar radiation components global horizontal irradiation (GHI) and direct normal irradiation (DNI). Own illustration using graphical content created by Arthur Shlain (Citation2019) from Noun Project
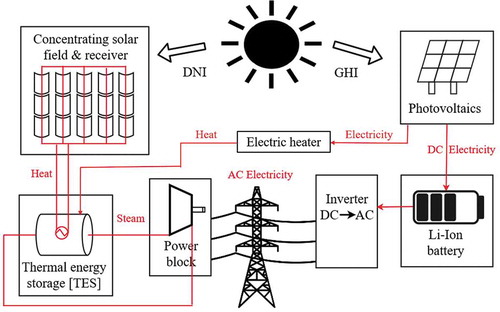
Figure 3. Conversion process from the collection of solar radiation to the final conversion to AC electricity and relevant cost parameters. Own illustration based on Lovegrove (2018)
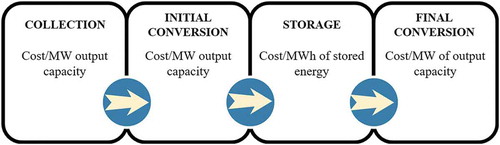
Figure 4. Solar profiles (GHI and DNI) for the modeled day and location in the Sierra Nevada in Spain. Day 1 in week 29 of a typical meteorological year based on the years 2007–2016
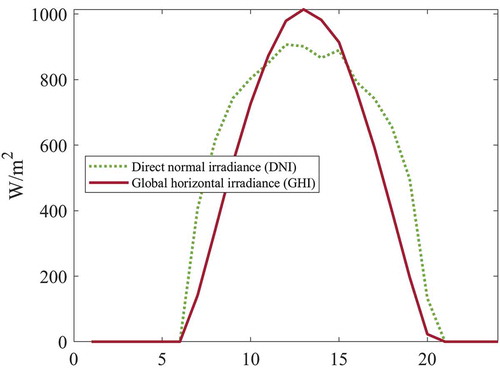
Figure 5. Electricity generation [MWel] by PV and the battery system and storage content [MWhel]
![Figure 5. Electricity generation [MWel] by PV and the battery system and storage content [MWhel]](/cms/asset/d74604fd-4def-4cee-b58c-849b0c03fd88/uesb_a_1843565_f0005_oc.jpg)
Table 1. Investment cost assumptions by component. Medium and low cost are cost development expectations up to 2050. All costs retrieved from the literature were converted to €2018. If there was no designated year mentioned for the cost assumptions, the year of publication was taken into account. Inflation rates are derived from Eurostat (Citation2019). Exchange rates refer to the last day of the respective year from ÖNB (Citation2019)
Table 2. Fixed operation and maintenance costs, annually by component. Medium and low cost are cost development expectations up to 2050
Table 3. Installed capacities for all technology components depending on the storage hours
Figure 6. Specific cost for increasing storage hours for PV+BESS, CSP+TES and PV+TES for three cost scenarios. PV+BESS is always the most economic solution for short storage times. CSP+TES becomes competitive after 2–3 h (current cost) and 4–10 h (future cost projections)
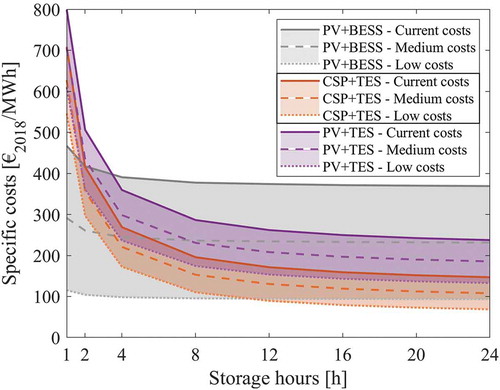
Figure 7. Shares of overall CSP investment costs for the components solar field + receiver, TES, and power block depending on the storage hours. Current cost (left bar), medium cost (middle bar), and low cost (right bar) scenario. The share of the power block decreases significantly with increasing storage hours
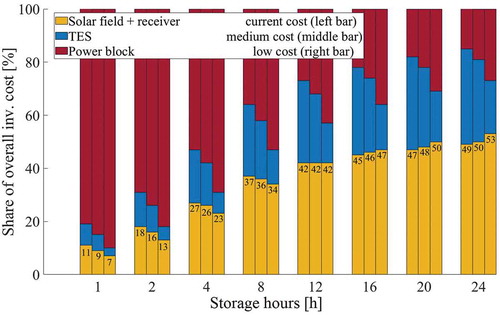
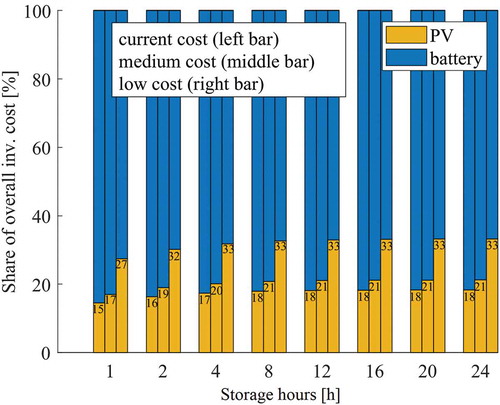
Figure 8. Shares of overall investment costs for the components PV and BESS depending on the storage hours. Current cost (left bar), medium cost (middle bar), and low cost (right bar) scenario. In contrast to CSP+TES, the ratio between the two components PV and battery stays almost the same for all storage hours
Availability of data
The data that support the findings of this study are openly available via Zenodo at https://doi.org/10.5281/zenodo.3939412.