
Figures & data
Figure 1. Heat pump system schematic diagram (Carroll, Chesser, and Lyons Citation2020)
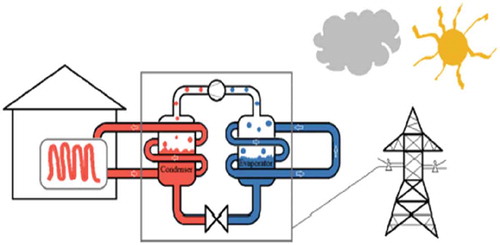
Table 1. Descriptive Statistics for average electricity use per home and temperature for Storm Emma, A Day during Storm Emma & The same day the following year
Figure 2. The averaged SH2.0 electricity usage TSt and Temperature, 28th February – 4th March 2018
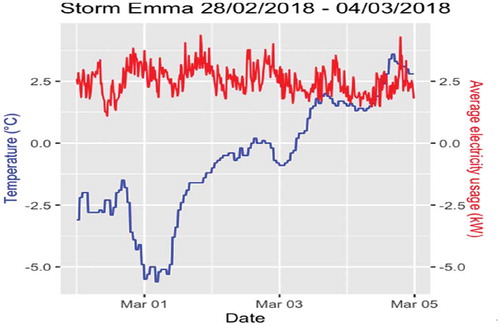
Figure 3. Coincident averaged electricity usage Histogram and Empirical Density, Storm Emma:28th February – 4th March 2018
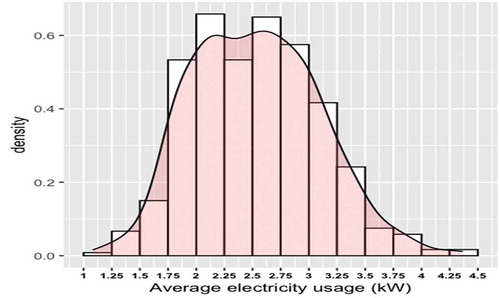
Figure 4. Skewness-kurtosis plot for average electricity usage (kw) as provided by the descdist function in R
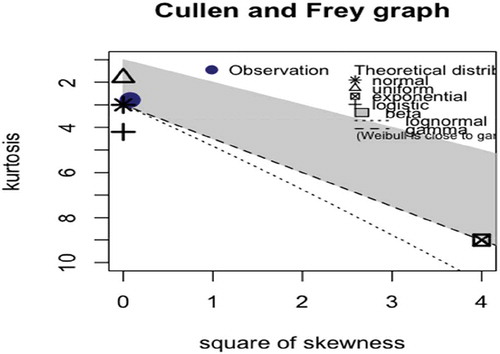
Figure 5. CDF plot of both the empirical distribution and the fitted distribution
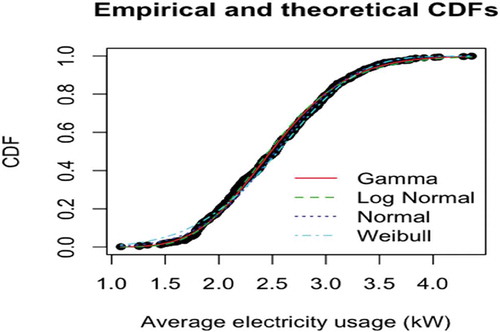
Figure 6. Density function of the fitted distribution along with the histogram of the Storm Emma empirical distribution
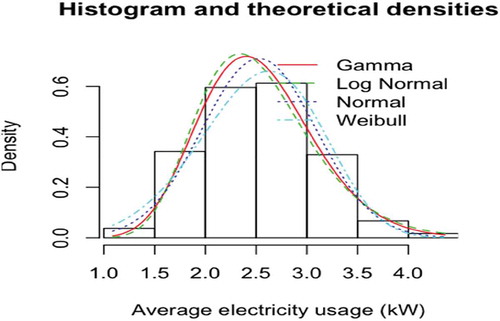
Figure 7. Q-Q plot representing the empirical quantiles (y-axis) against the theoretical quantiles (x-axis)
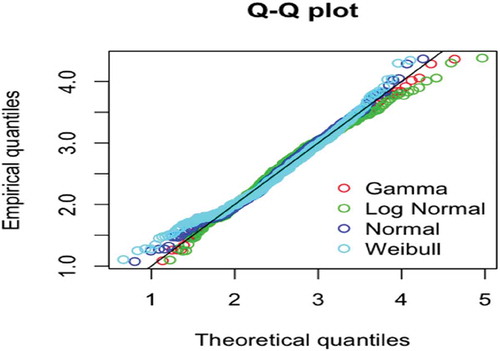
Figure 8. P-P plot representing the empirical distribution function evaluated at each data point (y-axis) against the fitted distribution function (x-axis)
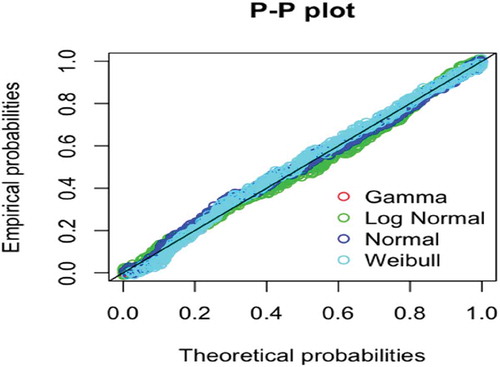
Table 2. Goodness-of-fit Statistics & Criteria