
Figures & data
Figure 1. Location of Ecuador on the world.
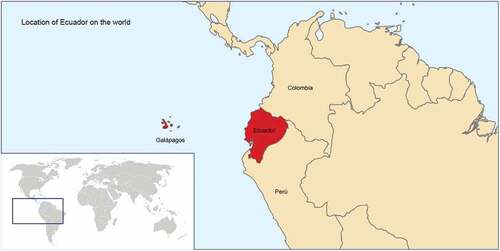
Figure 2. Location of Loja, Ecuador.
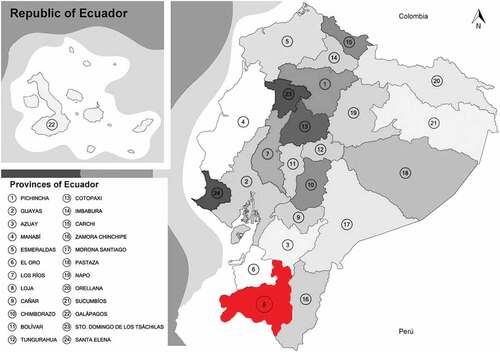
Table 1. Effective Power in Electric Power Generation of Ecuador.
Figure 3. Villonaco wind farm geographic setting.
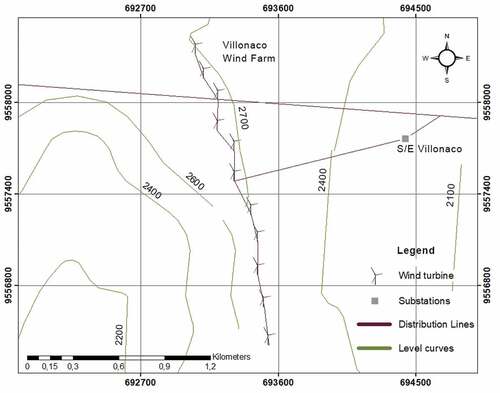
Figure 4. Data acquisition system.
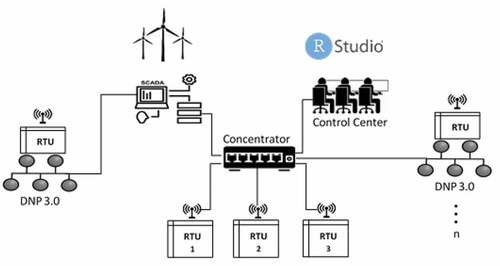
Figure 5. Flow diagram of the method.
Figure 6. Wind Speed, temperature, wind rose and frequency distribution of Villonaco.
Figure 7. Wind speed and temperature per seasons.
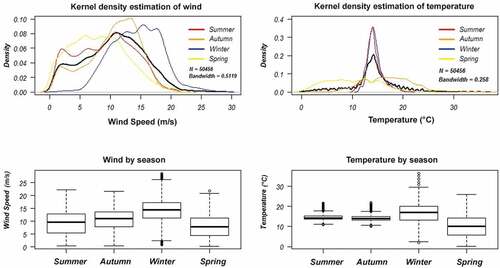
Figure 8. Generation of the Villonaco Wind Farm.
Figure 9. Generation per seasons.
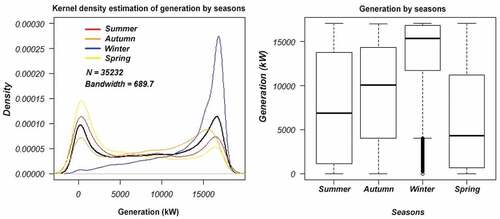
Figure 10. Electricity use in the urban area of Loja from May 2018 to April 2019.
Figure 11. Annual electricity demand curve.
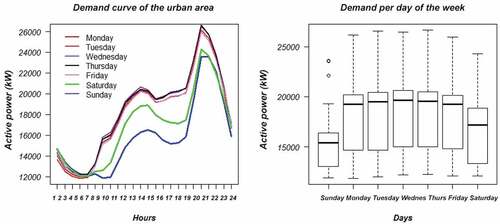
Figure 12. Overlay of generation and usage data, May 2018 – April 2019.
Figure 13. Generation and use by seasons.
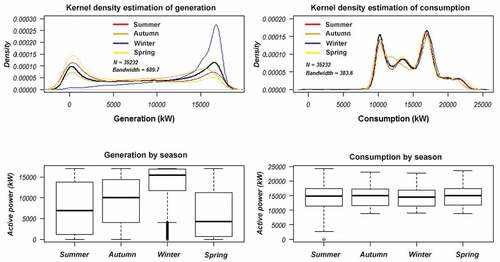
Figure 14. Superposition of generation and use data, May 2018.
Figure 15. Surplus/deficit, May 2018.
Figure 16. Generation/consumption per day of the week.
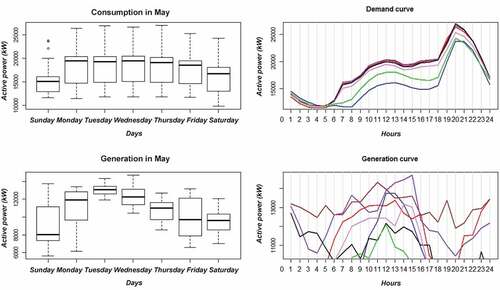
Figure 17. Surplus/Deficit of the Villonaco-Loja May 2018 to April 2019.
Table 2. Wind generation, energy use, surplus and deficit, energy balance.
Table 3. Wind generation, energy use, surplus and deficit, energy balance expansion.