
Figures & data
Table 1. Summary of audit quality research status.
Table 2. Analysis table of research status in China and other countries.
Table 3. Descriptive statistical results.
Figure 1. Correlation coefficients.
Figure 2. Regression results of audit quality and photovoltaic enterprises’ fund-raising efficiency.
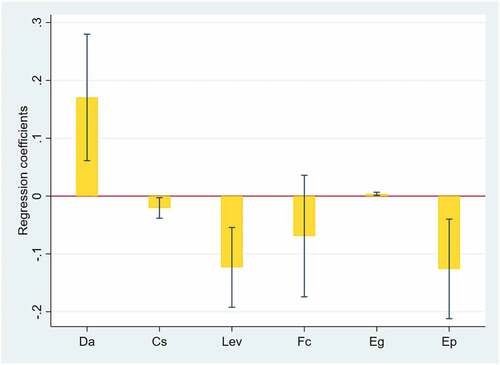
Table 4. Regression results of audit quality and photovoltaic enterprises’ fund-raising efficiency.
Figure 3. Regression results of audit quality and photovoltaic enterprises’ fund allocation efficiency.
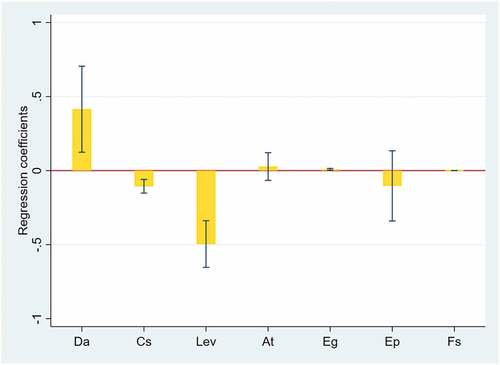
Table 5. Regression results of audit quality and photovoltaic enterprises’ fund allocation efficiency.
Figure 4. Regression results of audit quality and financing efficiency of the photovoltaic enterprises.
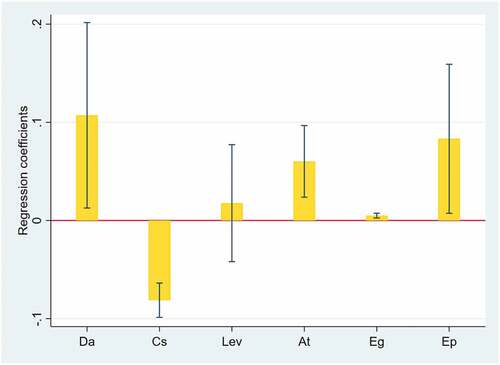
Table 6. Regression results of audit quality and financing efficiency of the photovoltaic enterprises.
Table 7. Test results of the intermediary effect of agency cost.
Figure 5. Test results of the intermediary effect of agency cost.
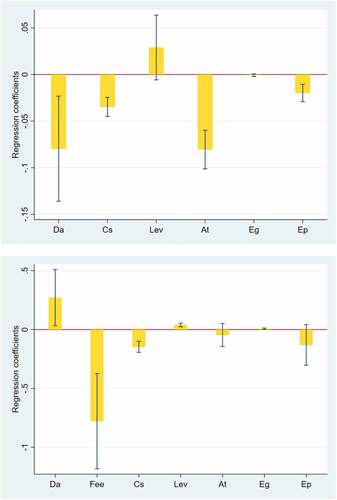
Table 8. Robust regression results of audit quality and photovoltaic enterprises’ fund-raising efficiency.
Table 9. Robust regression results of audit quality and photovoltaic enterprises’ fund allocation efficiency.
Table 10. Robust regression results of audit quality and financing efficiency of the photovoltaic enterprises.
Table 11. Robustness test results of the intermediary effect of agency cost (a).