
Figures & data
Table 1. Identified economic factors of CO2 emissions.
Table 2. Descriptive statistics and preliminary tests.
Table 3. Estimation results of the pooled panel data regression model.
Figure 1. Moran’s I scatter diagrams of CO2 emissions in the selected years.
Table 4. Values of Moran’s I.
Table 5. Estimation results of the RE-ESF panel model.
Table 6. Summary of the spatially varying coefficients of the RE-ESF-SNVC model.
Figure 2. Median values of the estimated spatially varying coefficients.
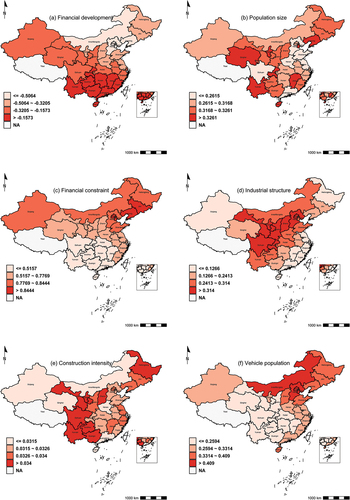
Table 7. Median values and locations of the spatially varying coefficients for each province.
Figure 3. Results of the geographically dividing line.
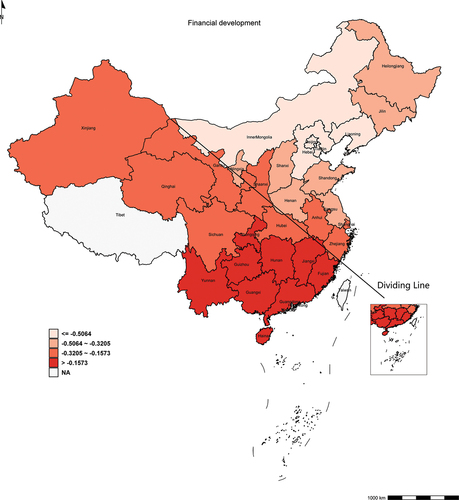
Table 8. One-way analysis of variance (ANOVA).
