
Figures & data
Table 1. Average distance traveled by age and mode: England, 2013 (all journeys).
Table 2. Journey difficulty categories by age group.
Figure 1. Employees' current issues with the journey to work (n = 308 out of 1215).
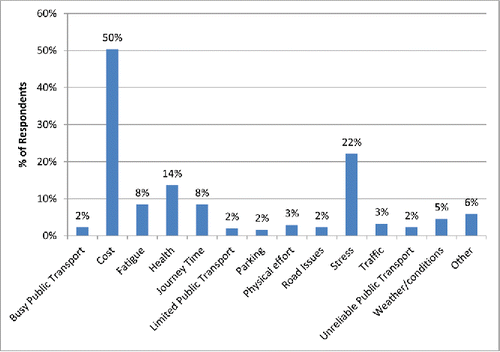
Table 3. Current journey difficulties by age group (highest % across all age groups in bold).
Table 4. Mitigating strategies implemented by the employee and/or facilitated by the employer.