Figures & data
Figure 1. Overall and transport greenhouse gas emissions in Germany and mitigation targets of the German Government (1990–2050).
Source: Reutter et al. (Citation2013, p. 8), (updated in 2019).
Sources of data: Umweltbundesamt (Citation2019a, Citation2019b, Citation2019c); BMUB (2016).
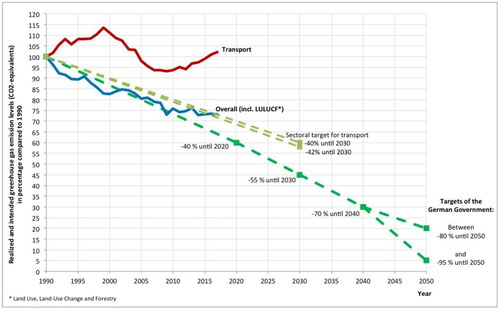
Figure 2. Urban structures of the Ruhr Metropolitan Region – all cities with more than 50,000 inhabitants.
Source: https://de.wikipedia.org/wiki/Ruhrgebiet#/media/Datei:Ruhr_area-map.png
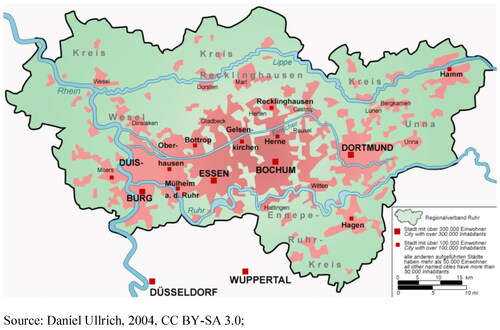
Figure 3. Methodological approach: Navigating toward sustainable urban passenger transport regarding direction, scale and speed of urban modal shift.
Own figure; similar figures see Hickman & Banister (Citation2007, p. 379) and Van Vuuren et al. (Citation2015, p. 305) (which is also used in Geels et al., Citation2020).
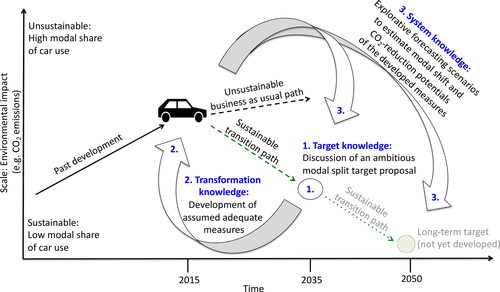
Figure 4. Subsystems of the integrated Ruhr Area model.
Source: Wegener (Citation2018, p. 5); Schwarze et al. (Citation2017, p. 13); color changes and slight amendments
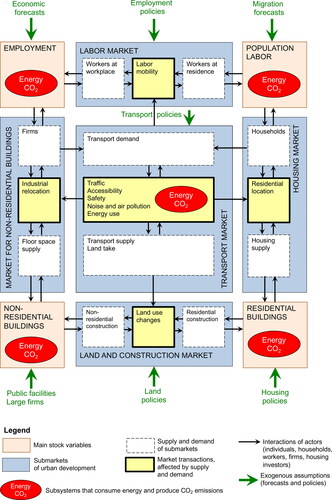
Figure 5. Scale of change needed: Current modal split in the Ruhr Metropolitan Region and proposed target for 2035.
Modal split data: Grindau & Sagolla (Citation2012); RVR (Citation2019); Target proposal: Reutter et al. (2013, Citation2017), RVR (2014).
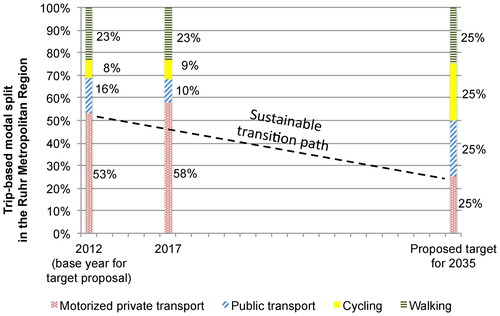
Table 1. Assumptions of the measures developed for modeling and similar real-world examples.
Table 2. Single and combined measure scenarios.
Figure 6. Modal share of car use (A-scenarios) and proposed target for 2035.
Modeling: S&W; Figure: S&W amended by Müller; PT = public transport
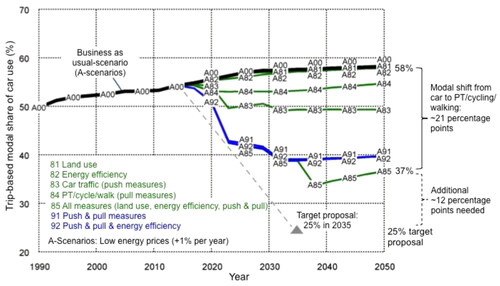
Figure 7. Modal share of car use (B-scenarios) and proposed target for 2035.
Modeling: S&W; Figure: S&W amended by Müller; PT = public transport
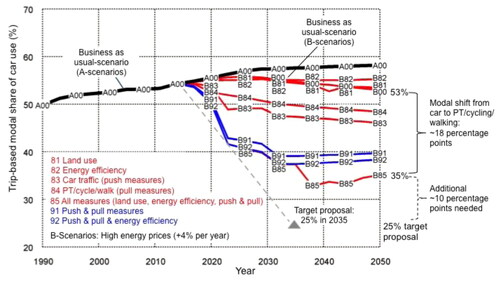
Figure 8. CO2 emissions of passenger transport (A-scenarios), climate protection targets of the German Government and net zero target by 2035.
Modeling: S&W; Figure: S&W amended by Müller; PT = public transport; net zero target by 2035 according to Fridays for Future & German Zero e.V.
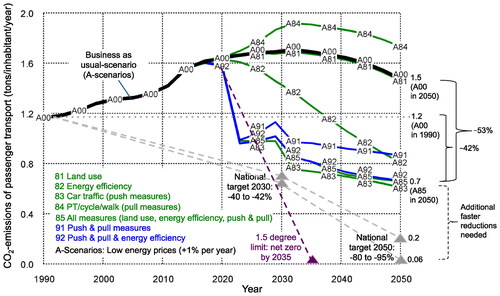
Figure 9. CO2 emissions of passenger transport (B-scenarios), climate protection targets of the German Government and net zero target by 2035.
Modeling: S&W; Figure: S&W amended by Müller; PT = public transport; net zero target by 2035 according to Fridays for Future & German Zero e.V.
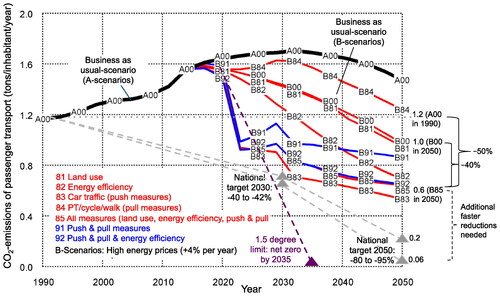
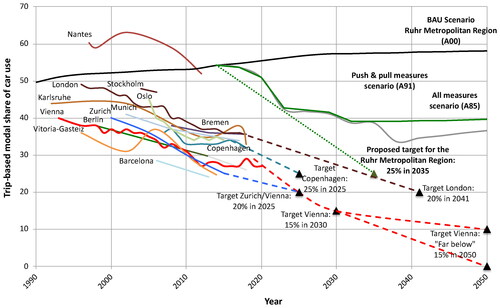
Figure 10. Potentials for reducing the modal share of car use: Indications from forecast scenarios and thirteen real-world city examples.
The rather conservative A-scenarios with only one percent fuel price increases per year and less modal shifts are used in the figure. City modal shifts represent overall developments in the cities, not the specific effects of the single measures presented in section 5.2. Data and sources: Supplemental online material.