
Figures & data
Figure 1. Cities investigated by number of inhabitants and classification as metropolis according to RegioStaR7 (BMVI, Citation2020c).
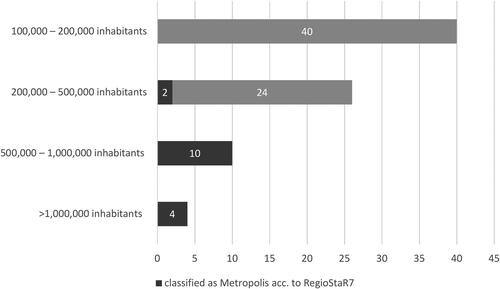
Table 1. User groups used as dependent variable categories.
Table 2. Summary of the independent variables used for the analysis.
Table 3. Five highest supply densities of station-based carsharing in 2019 (Data from 2013 and 2019).
Table 4. Five highest supply densities of free-floating carsharing in 2019 (Data from 2013 and 2019).
Figure 2. Total number of station-based and free-floating carsharing vehicles in Germany (own display based on BCS, Citation2013, Citation2015, Citation2017, Citation2019).
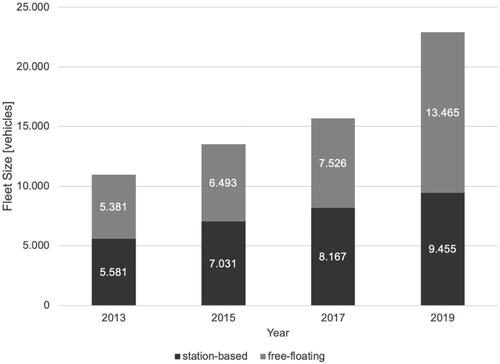
Table 5. Sociodemographic characteristics for the groups of carsharing members and nonmembers (Data from 2017).
Table 6. Undertaken trips by carsharing members and nonmembers including distribution across transport modes (Data from 2017).
Table 7. Model results and odds-ratios of multinomial logit regression.