
Figures & data
Table 1. Characteristics of respondents (some questions not answered by all).
Table 2. Reasons for buying or considering buying an e-bike (multiple options allowed).
Table 3. Non-work uses of e-bikes (multiple options allowed).
Figure 1. Frequency of use of e-bikes (N = 1347) and conventional bikes (N = 853) amongst e-bike users.
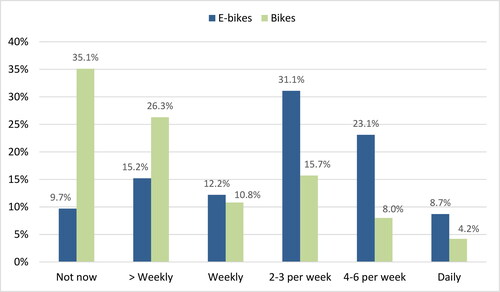
Table 4. How would you compare your riding an e-bike with riding a conventional cycle?
Figure 2. Main commute modes of the employed or self-employed respondents (N = 1224).
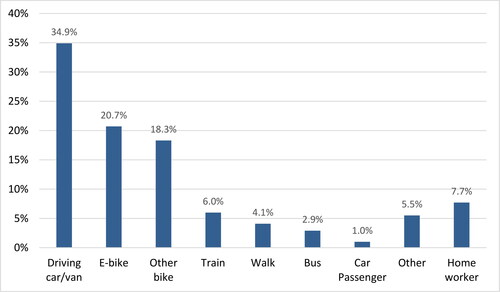
Table 5. Why do you commute by e-bike?
Table 6. Before you started commuting by e-bike, what was your main commute mode?.
Table 7. For what type of work travel have you used an e-bike?.
Figure 3. Frequency of e-bike work travel over the past month (N = 245).
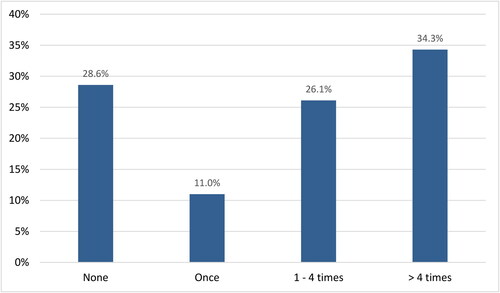
Table 8. Demographic differences by gender.
Table 9. Gender difference regression (all significant in bivariate π2 tests – not shown).