
Figures & data
Table 1. List of variables and their operationalization along with data sources.
Figure 1. The Ottawa streetscape categories. Basemap tiles by Stamen Design, under CC BY 3.0. Data by OpenStreetMap, under ODbL.
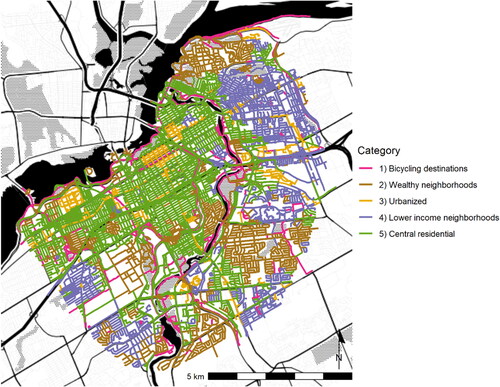
Figure 2. Distributions by street segment (n = 12,170, 1,215 km) for the variables used to classify streetscape category. Scaled values are shown to compare multiple units. Note varying x axis.
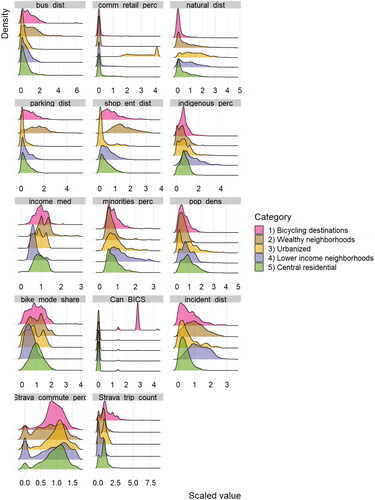
Figure 3. Bubble chart showing how the incidents normalized by street length varies with the number of Strava riders for each streetscape category. The bubble number lists the category and the size of the bubble represents the total length in kilometers.
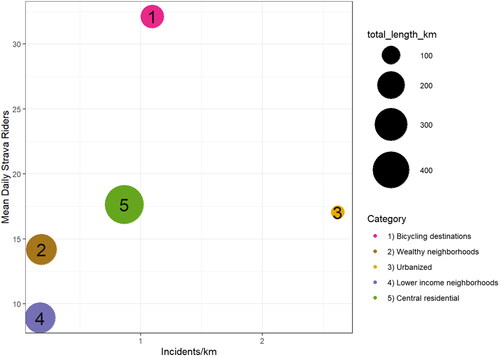
Table 2. Summary of the geometry, length-weighted means (for continuous variables), and proportions (for categorical variables) for the streetscape category.