Figures & data
Table 1. Parameter values for estimation of PHEV and BEV market shares, and the coefficient of determination (R2).
Table 2. Indirect emissions from vehicle production, maintenance and end-of-life in 2018 and 2030, respectively (based on Ricardo, Citation2020, with modifications).
Table 3. Specific direct and indirect emissions as well as energy use in 2018 and 2030, among new cars.
Table 4. The number of shared and non-shared cars in six scenarios for 2030 and in 2018 for reference.
Figure 1. Vehicle kilometers by type of energy used in the scenarios. Reference values for comparison for 2018 and 2030 from Trafikanalys (Citation2019a) and STA (Citation2020c), respectively.
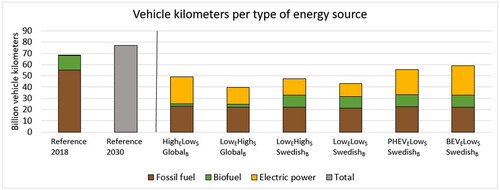
Figure 2. Number of households with access to shared and non-shared cars, shared cars only, and non-shared cars only, in the 2030-scenarios as well as an estimate for 2018. The number of shared cars in 2018 is assumed to be negligible. Reference values for 2018 from Statistics Sweden (Citation2023a) (number of households) and BilSweden (Citation2019) (share with car access).
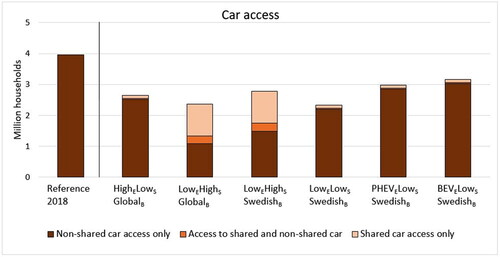
Figure 3. Accumulated direct GHG emissions and indirect fuel and vehicle cycle GHG emissions. The first column group refers to 2018 data multiplied by a factor eight to make them comparable to the following six column groups, representing accumulated emissions 2023-2030 in the six scenarios.
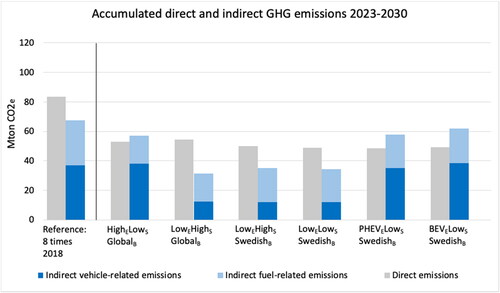
Figure 4. The accumulated indirect emissions in the scenarios 2023-2030 and a comparative “budget ceiling” for indirect emissions within EU ETS. Staying below the budget ceiling means indirect emissions do not increase beyond their current share of total emissions within EU ETS.
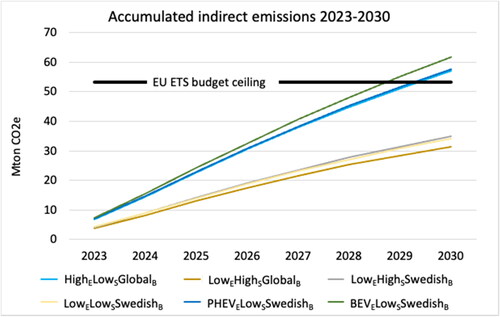
Table 5. Fleet total battery energy storage capacity in GWh, including an estimate for 2018 as reference, with per car battery capacities based on Power Circle (Citation2018).
Table 6. Fleet battery utilization in the scenarios (electric vehicle km/(kWh*year)).
Figure 5. Total number cars removed annually between 2023 and 2030. Included are also, the historical numbers for 2011 to 2020 (Trafikanalys, Citation2019b) and a forecast from Trafikanalys (Citation2021a) for 2021 and 2022.
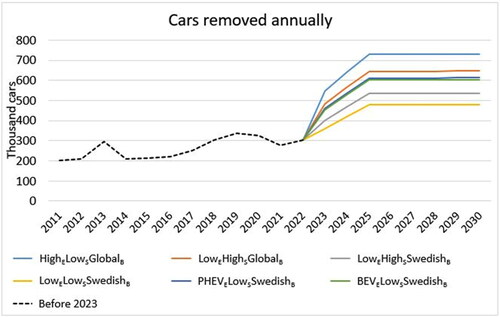
Table 7. Average annual rate of removal and addition of cars for 2023–2030 in the scenarios divided by the averages during 2011–2020.
Figure 6. ICEVs, PHEVs, and BEVs added during 2018–2030 in the scenarios. For the years before 2023, statistics and short-term forecasts from Trafikanalys (Citation2021a) are used.
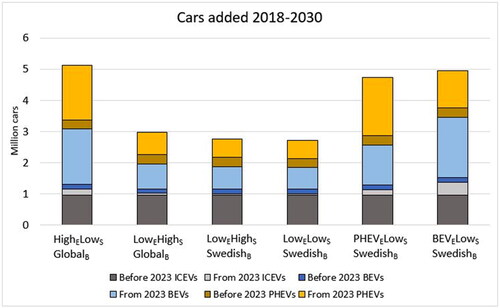
Figure 7. ICEVs, PHEVs, and BEVs removed during 2018–2030 in the scenarios. For the years before 2023, statistics and short-term forecasts from Trafikanalys (Citation2021a) are used.
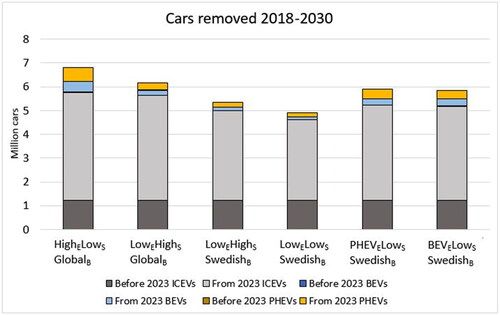
Figure 8. Number of households with car access and total travel distance in the scenarios normalized against the scenario maximum. In 2018, the value for car access was 1.25 times index = 1, and the value for distance traveled was 1.16 times index = 1.
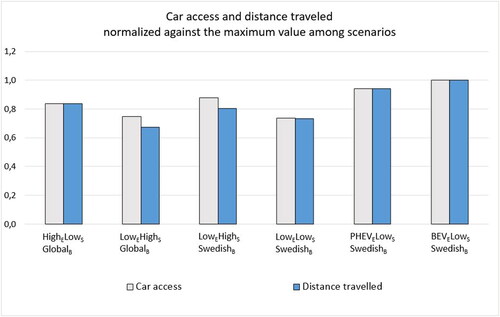
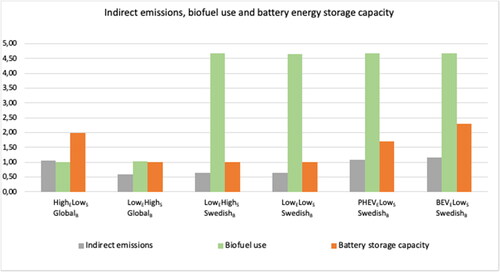
Figure 9. Accumulated indirect emissions 2023-2030, biofuel use and battery energy storage capacity in the scenarios. Indirect emissions are normalized against the long term EU ETS ceiling (see Section 5.2). Biofuel use and Battery storage capacity are normalized against the scenario minimum. In 2018, biofuel use was 6.1 times the scenario minimum, and battery storage capacity was 0.02 times the scenario minimum.