
Figures & data
Figure 1. Illustration of map used in the survey.
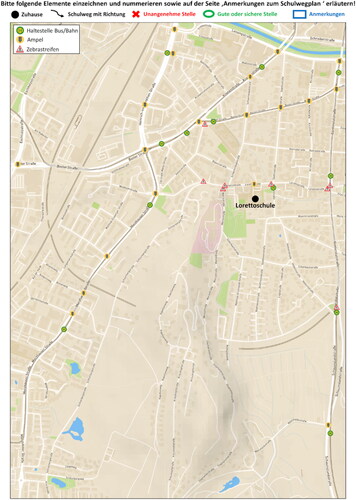
Figure 2. Illustration of the digitalized school routes.
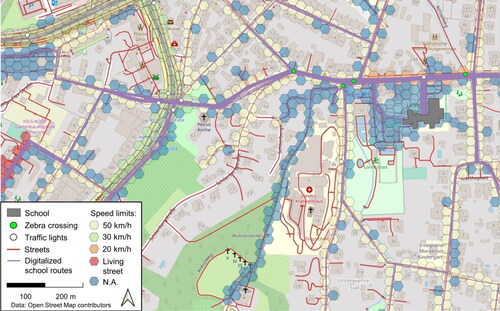
Table 1. Descriptive information about school route variables, separately as absolute values and in proportion to the number of hexagons of the respective school route.
Figure 3. Distribution of transportation mode by school year.
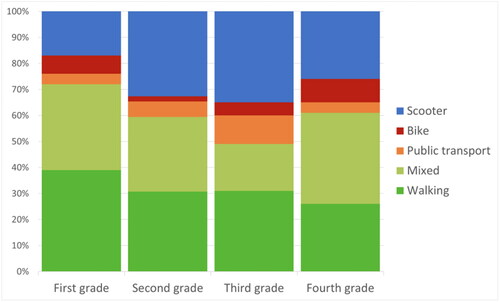
Table 2. Length and duration of school routes, separately for transportation mode.
Figure 4. Distribution of accompaniment status by school year.
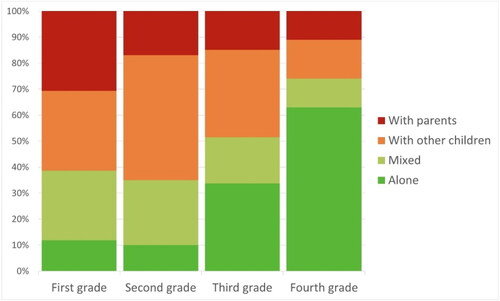
Table 3. Details concerning all parameter estimates in the generalized estimating equations model testing the effects of demographic and route variables on the safety ratings of children and their parents.
Figure 5. Distribution of children’s and parents’ safety ratings, depending on transportation mode (with the respective number of children using this transportation mode in brackets).
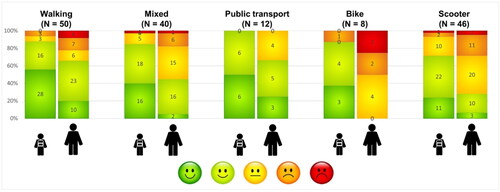
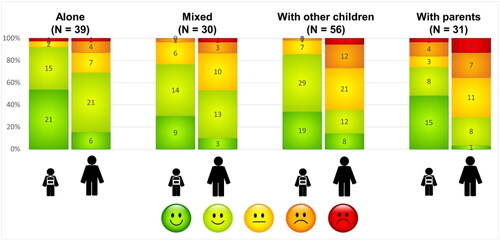
Figure 6. Distribution of children’s and parents’ safety ratings, depending on accompaniment status (with the respective number of children indicating this accompaniment status in brackets).
Data availability statement
The data that support the findings of this study are available on request from the corresponding author. The data are not publicly available due to containing information that could compromise the privacy of research participants.