Figures & data
Table 1. The primer sequences used for qRT-PCR.
Figure 1. Effects of topical application of SIN on ocular surface damage in experimental dry eye in mice, evaluated by phenol red cotton test for the quantification of tear production (8 mice, 16 eyes in each group). Data shown as mean ± SD. * p < 0.05.
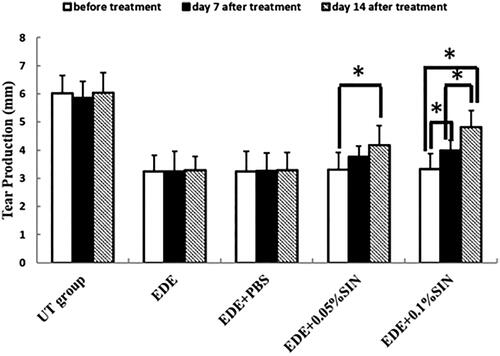
Figure 2. Mean corneal fluorescein staining scores in the untreated (UT) control, experimental dry eye (EDE), 0.05% sinomenine (SIN) treated, and 0.1% SIN-treated groups before treatment and 7 and 14 days after treatment (8 mice, 16 eyes in each group). Data shown as mean ± SD. * p < 0.05.
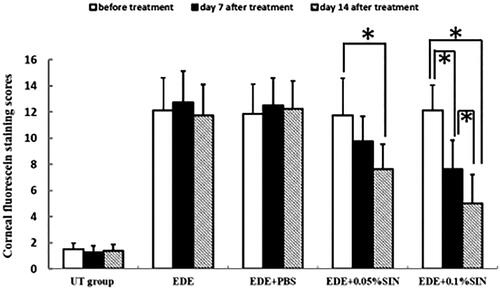
Figure 3. Real-time PCR analysis of IL-1β expression in mice (8 mice,16 eyes in each group). *Significant difference when compared with pre-treatment values (p < 0.05). Error bars represent SD.
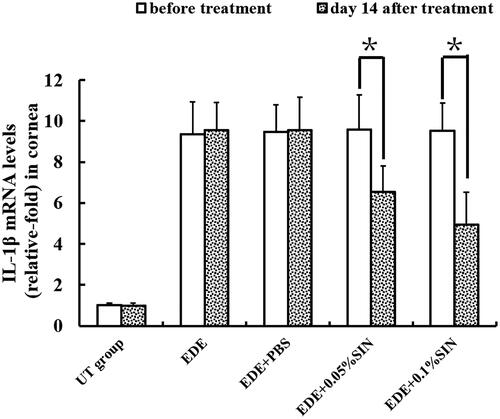
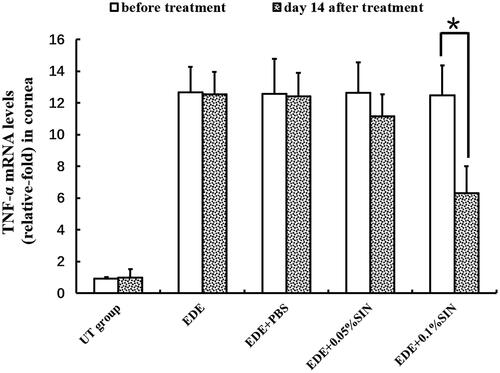
Figure 4. Real-time PCR analysis of TNF-α expression in mice (8 mice,16 eyes in each group). *Significant difference when compared with pre-treatment values (p < 0.05, n = 16 eyes). Error bars represent SD.