Figures & data
Table 1. Percentage of Charter Schools Outperforming Local School District by Model.
Table 2. Percentage of Charter Schools Outperforming The Stateby Model.
Table 3. Arizona’s Participation, Proficiency, and Average Scores by Model.
Table 4. California’s Participation, Proficiency, and Average Scores by Model.
Table 5. Florida’s Participation, Proficiency, and Average Scores by Model.
Table 6. Texas’s Participation, Proficiency, and Average Scores by Model.
Figure 1. Top Ten Charter School Models by 2018-19 NAEP-Weighted Z Scores - RLA.
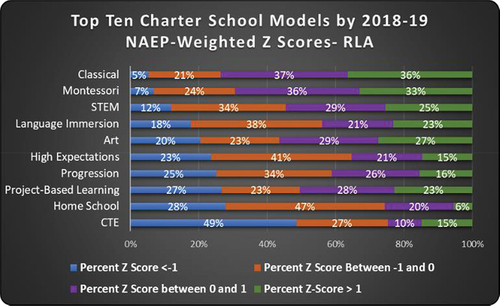
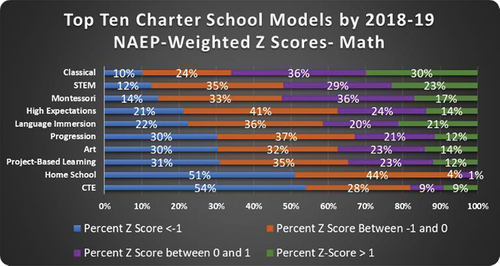
Figure 2. Top Ten Charter School Models by 2018-19 NAEP-Weighted Z Scores - Math.