Figures & data
Figure 1. Overview of the four phases of the SRP
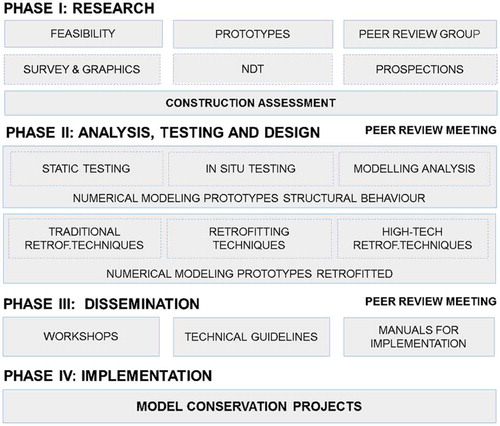
Figure 2. SRP workshop: (a) participants attending the non-destructive testing demonstration; and (b) participants applying different mixes of mortar on stone masonry
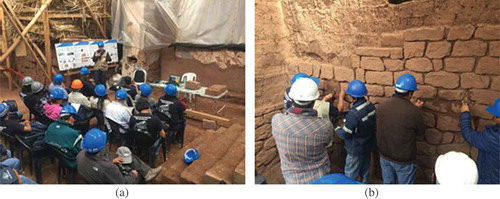
Figure 3. Seismic activity in South America: (left) historical earthquake database in Peru, for the period of 1900–2013 AD, with a magnitude range 5.5≤ Mw> 8.0, as compiled from the U.S. Geological Survey (Hayes et al. Citation2014); (right) seismic hazard map of 2014, with values of PGA in the range of 0–1.0 g and relative plate motion values (Hayes et al. Citation2014)
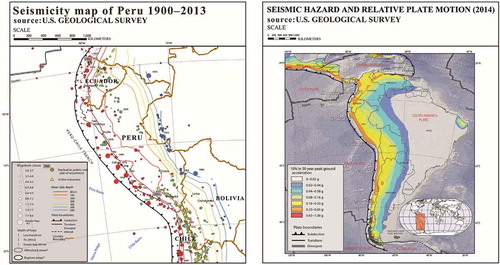
Figure 4. Failure mechanisms in earthen structures, induced by earthquakes: (a) collapse of the main façade due to rocking in the Church of Guadalupe, Ica 2007 (Cancino et al. Citation2011); (b) horizontal and diagonal shear cracks induced by rocking motion of independent structural parts in the church of Santísima Trinidad, Cusco 2014; (c) corner separation (Tarque Citation2008); (d) shear cracks near openings (Tarque Citation2008); (e) overturning failure of the corner of a lateral wall (Tolles Citation2006); and (f) out-of-plane overturning of entire adobe walls (Cancino et al. Citation2011)
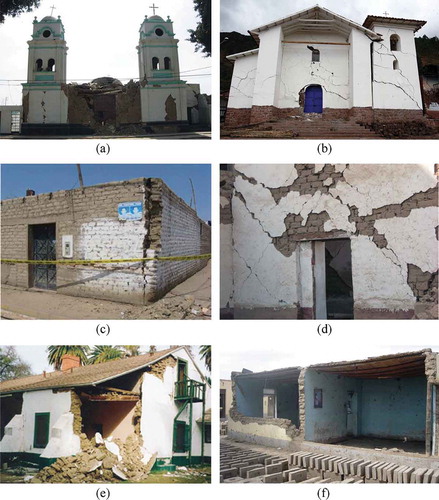
Figure 5. Typical failure mechanisms in earthen structures
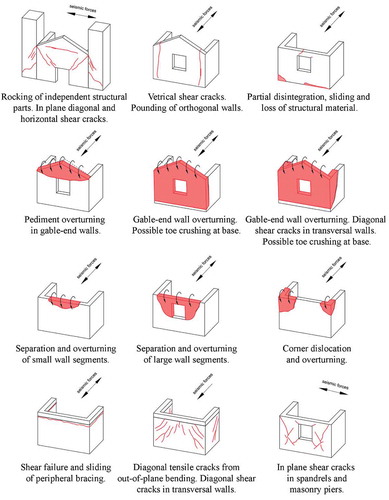
Figure 6. The Church of Kuño Tambo: (a) selected capacity curves for the principal direction; (b) crack pattern of east facade (left) and gable-end wall of baptistery; (c) first mode shape from dynamic in-situ tests, with geometric interpolation; (d) FE model in 3D view; and (e) plot of maximum principal strain distribution at load step near collapse
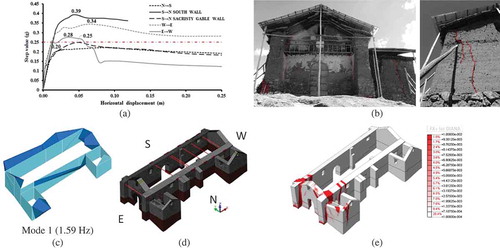
Table 1. The Church of Kuño Tambo: Mechanical properties of structural elements (Lourenço, Karanikoloudis, and Greco Citation2016)
Table 2. Ica Cathedral: Mechanical properties of structural elements (Lourenço, Karanikoloudis, and Greco Citation2016)
Figure 7. Ica Cathedral: (a) Selected capacity curves for two principal directions; (b) crack pattern of east facade (right) and collapsed main dome and barrel vault (left); (c) first mode shape from dynamic in-situ tests, with geometric interpolation; (d) FE model in 3D view; and (e) plot of maximum principal strain distribution at load step near collapse
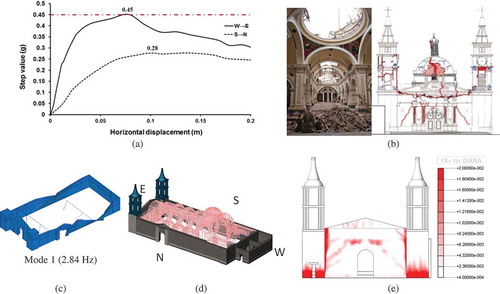
Table 3. List of technical norms and national codes for the design and evaluation of earthen buildings and strengthening components
Figure 8. Detailing of traditional strengthening techniques, implemented in the Church Kuño Tambo: (a) cross section of new buttress, with horizontal timber keys, new interlocking, and geo-mesh; (b) detail of horizontal timber key between buttress and adjoining wall, with vertical key anchors to enhance connectivity (in red); (c) timber embedded corner keys in elevation and continuous bond beam at top eave; (d) detail of combined timber frame system, with bond beam, tie beam and vertical timber anchors; (e) timber embedded elements in elevation and horizontal planes; (f) and (g) implementation of timber keys in new adobe buttress during construction phase; and (h) implementation of tie beams and bond beam system, during the constructions phase (‘Kuñotambo’ Citation2017)
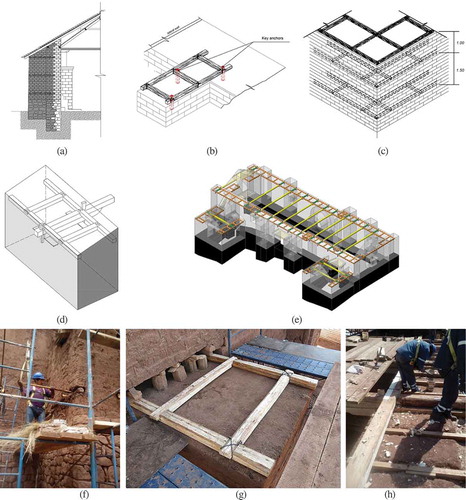
Figure 9. Detailing of traditional strengthening techniques, implemented in Ica Cathedral: (a) U-beam at top eaves, in parts with low out-of-plane resistance, configuration with two longitudinal timber beams and transversal timber blockers (in blue). Upper anchoring system in the lateral wall of the nave (in red); (b) lower anchoring system in the lateral wall of the nave (in red); (c) connection between masonry wall and timber floor. Tying system with tie beams, vertical and horizontal timber anchors; (d) connection between masonry wall and timber pillar, with horizontal timber anchors; and (e) configuration embedded timber strengthening elements, in 3D view
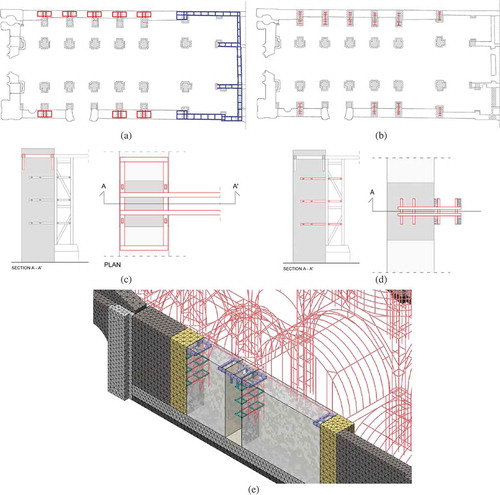
Figure 10. Principle-based matrix for conservation and engineering principles. Implementation for: (a) Ica Cathedral; and (b) the Church of Kuño Tambo (Cancino et al. Citation2016)
Figure 11. Experimental results on pull-out tests from PUCP: (a) tie beam and anchor of testing assembly; (b) cone failure; (c) pull-out testing procedure; and (d) maximum pull-out test results versus wall thickness, and linear regression trend (Torrealva and Vicente Citation2014)
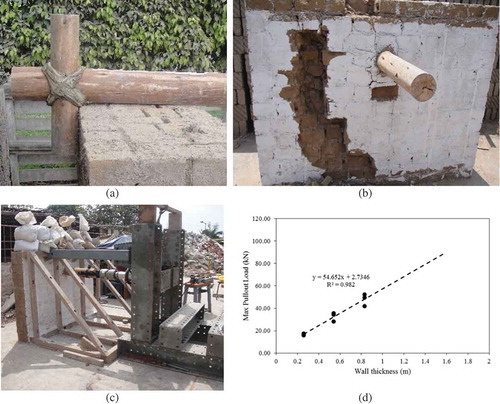
Figure 12. Experimental results on pull-out tests from PUCP: (a) tie beam and anchor of testing assembly; (b) cone failure; (c) pull-out testing procedure; and (d) maximum pull-out test results vs. wall thickness, and linear regression trend (Torrealva and Vicente Citation2014)
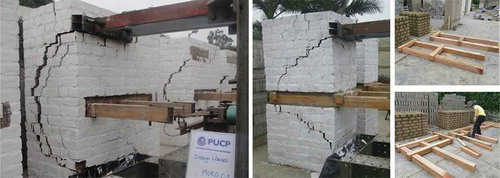
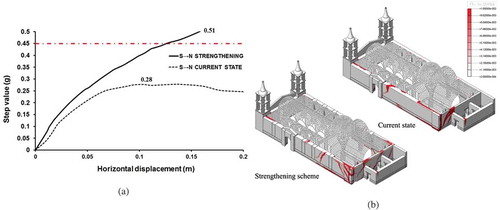
Figure 13. The Church of Kuño Tambo: (a) load-displacement diagram, at the top of the south wall. Note the seismic demand of 0.25 g (in red); and (b) distribution of maximum principal tensile strains for 20 cm of lateral displacement for the model at current and strengthening state. (Note that the results are from the numerical models with material properties updated by in-situ sonic tests.)
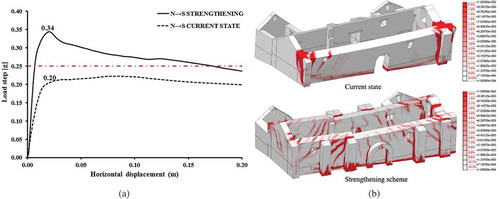
Figure 14. Ica Cathedral: (a) load-displacement diagram, at the top of the north wall. Note the seismic demand of 0.45 g (in red); and (b) distribution of maximum principal tensile strains for 20 cm of lateral displacement for the model at current and strengthening state