Figures & data
Table 1. Mechanical properties of the investigated mortars.
Table 2. Mechanical properties of the used reinforcement.
Figure 1. View of the testing set-up for the reinforced mortar plates.
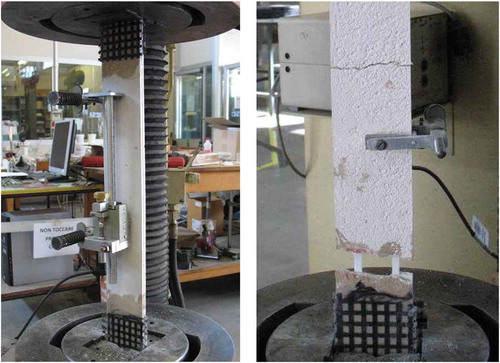
Figure 2. View of the loading set-up for the flexural test of the reinforced masonry stacks.
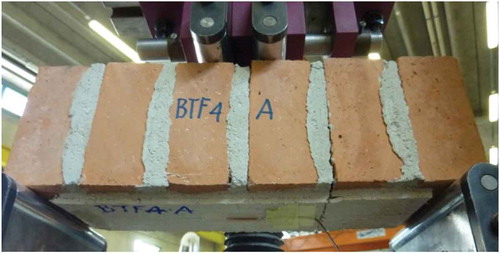
Figure 3. View of the diagonal test set-up.
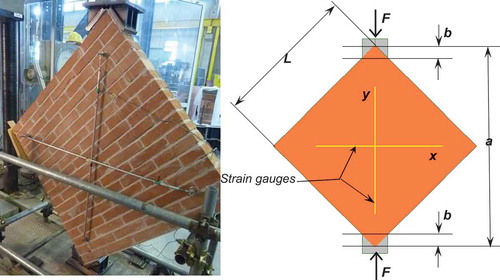
Table 3. Results of the diagonal tests of the 14 experimental walls.
Figure 4. View of the BTC-A and BTG-B panels after the tests.
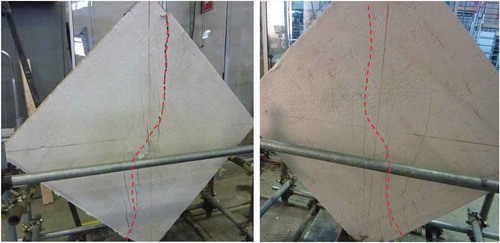
Figure 5. Load–displacement curves and derivatives of the tested panels reinforced with G-FRP meshes and steel strips.
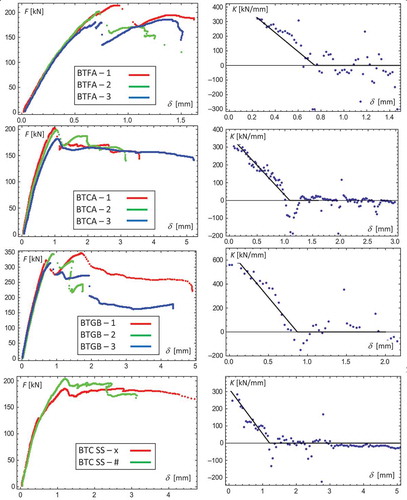
Figure 6. View of the photo-elastic analysis of the diagonal test and skew-symmetric collapse line.
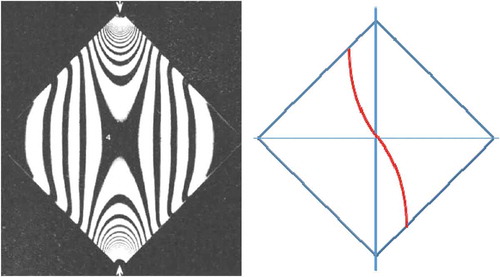
Figure 7. FEM of the homogeneous and composite panels under diagonal loading.
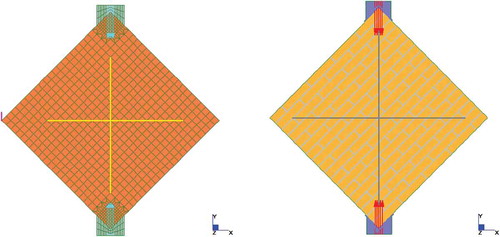
Figure 8. Shear stress distribution under a 100 kN loading of the homogeneous and composite panels.
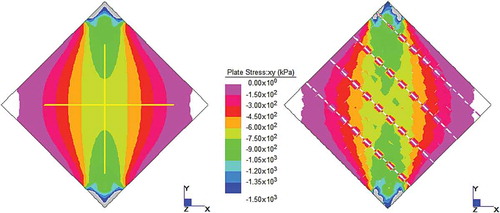
Table 4. Comparison of the results on the centre of FEM models with guidelines (F = 100 kN).
Figure 9. Distribution of the tensile stresses in the vertical diagonal at 100 kN loading.
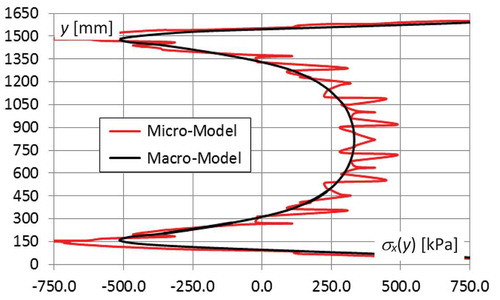
Figure 10. Distribution of the shear stresses in the vertical diagonal of the wall at 100 kN loading.
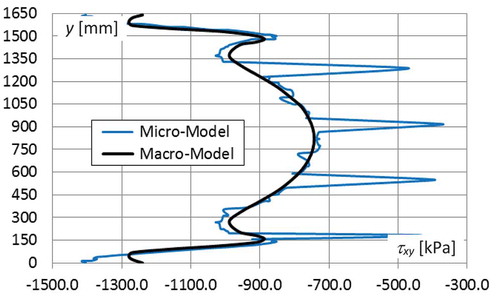
Figure 11. Limit equilibrium of the internal stresses on the yield line.
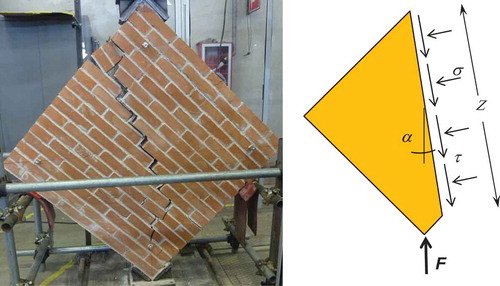
Figure 12. Mohr–Coulomb representation of the FRM constitutive relationship.
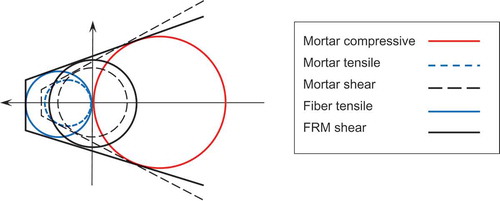
Table 5. Comparison of the experimental and theoretical average wall moduli.
Table 6. Comparison of the experimental and theoretical average shear strength.
Table 7. Tensile equivalent properties of the mesh according to Eq. 8.
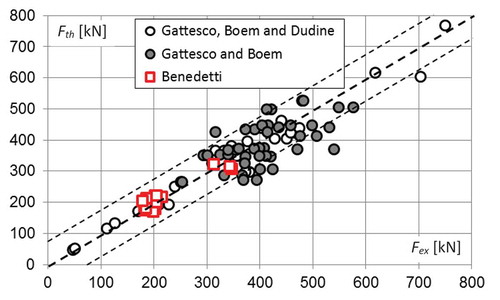
Table 8. Predicted values of the Gattesco, Boem and Dudine (Citation2015) experiments.
Table 9. Predicted values of the Gattesco and Boem (Citation2015) experiments.
Figure 13. Graphical representation of the theoretical versus experimental results of and .