Figures & data
Figure 1. Examples of typical URM buildings located in historic city centres of Central and Southern Europe
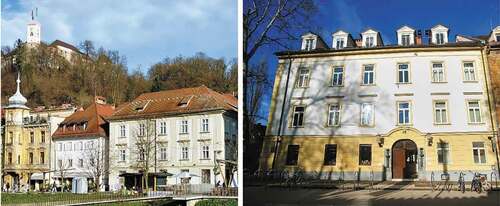
Figure 2. Typical FRP grid layout on an URM panel
Table 1. Mechanical properties of masonry
Figure 3. Geometry of the examined masonry building with indicated macro-elements (piers, spandrels and rigid zones)
Figure 4. Results of nonlinear static analyses of the URM building
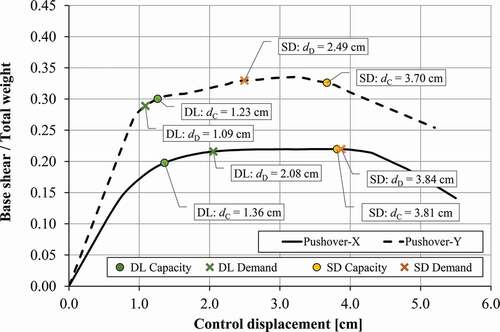
Figure 5. (a) Calculation of the target top displacement for the DL limit state based on the N2 method and (b) piers with exceeded seismic demand for the DL limit state (shaded elements)
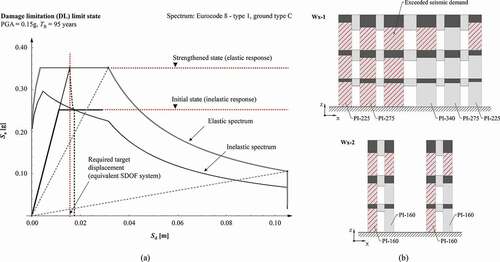
Table 2. Geometry and shear capacity of URM piers and the DL limit state demand
Table 3. Mechanical properties of FRP reinforcement
Figure 6. Shear capacity of pier PI-275-G in terms of the vertical force for its initial (URM) state and for three CFRP distributions
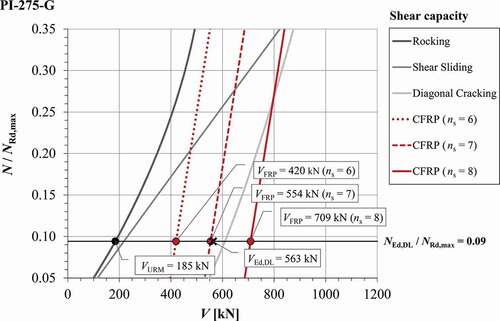
Figure 7. Parametric analysis of the FRP efficiency ratio (VEd,DL/VFRP) expressed in terms of the number of horizontal FRP strips
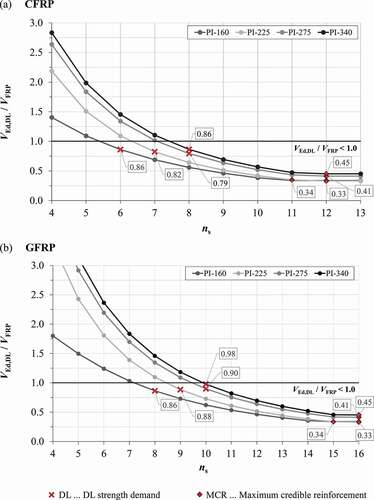
Table 4. Shear capacities of CFRP and GFRP strengthened piers for the DL limit state demand and the MCR
Figure 8. Schematic representation of CFRP layouts based on the DL design condition on wall assemblage Wx-1
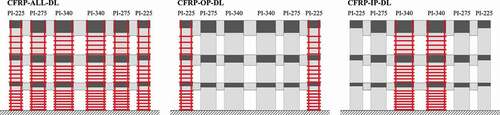
Table 5. Control displacements
Figure 9. Pushover curve comparison of analysed FRP layouts and of the URM case
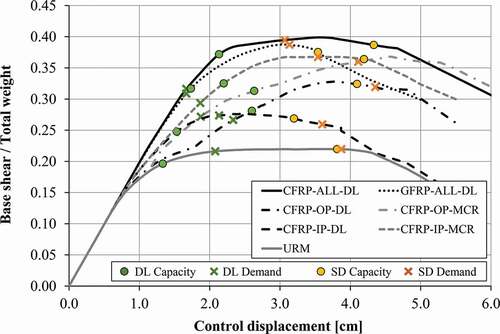
Figure 10. Inter-storey drifts of analysed cases for the DL demand (PGA = 0.15 g) and SD demand (PGA = 0.25 g)
Figure 11. Damage patterns of analysed FRP layouts on wall assemblage Wx-1
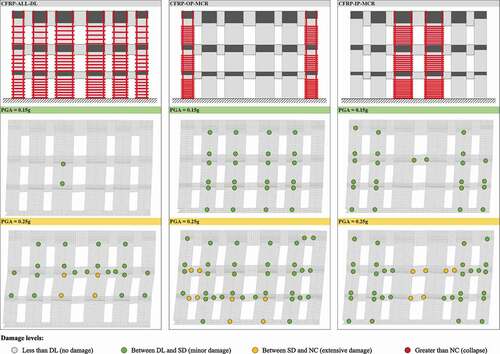
Table 6. Adopted limit values of chord rotations for piers and spandrels in terms of their failure modes
Table 7. PGA and TR of analysed variants
Table 8. Calculation of the CI for two considered limit states
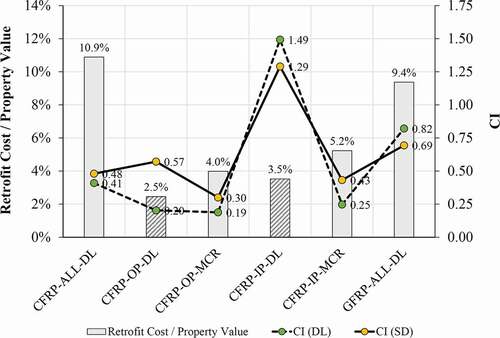
Figure 12. Retrofit cost vs. the property value ratio and CI of analysed variants