Figures & data
Table 1. Details of specimens.
Table 2. Material properties of Canadian hemlock.
Figure 1. Schematic diagram of dovetail mortise-tenon joint model.
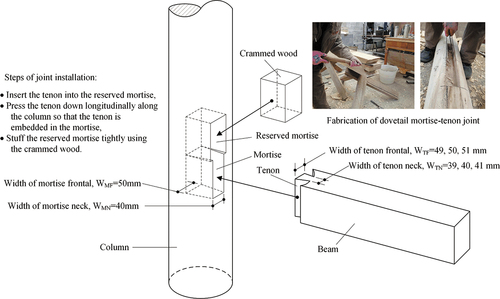
Table 3. Material properties of damper.
Figure 2. Damper construction.
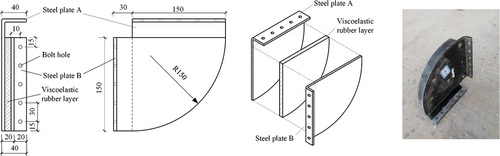
Figure 3. Damper stalled on the column-beam joint.
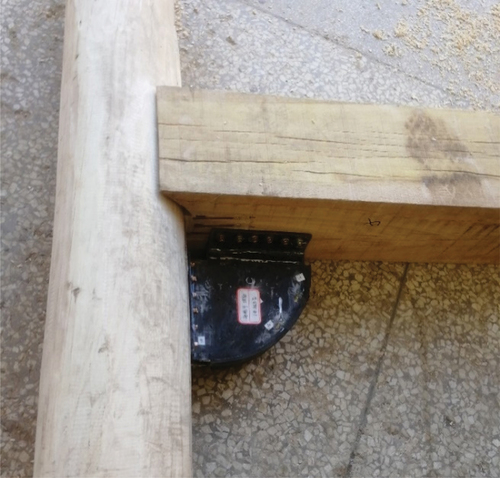
Figure 4. Damper test setup.
Figure 5. M-θ hysteretic loops of the three damper specimens (a) Deformation characteristic curve (b) Frequency characteristic curve (c) Fatigue characteristic curve.
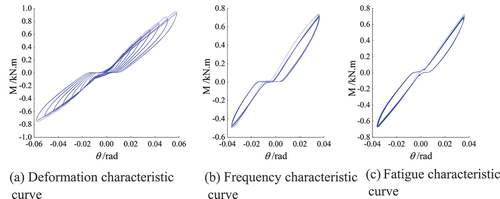
Figure 6. Wood joint test setup (all dimensions in mm) (a) Test design (b) Overview of the test setup.
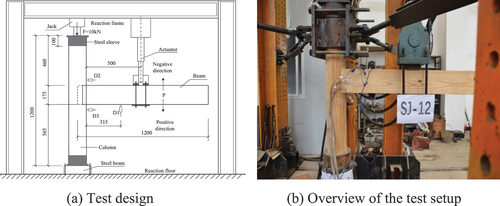
Figure 7. Loading schedule.
Figure 8. The sticking location of the strain gages.
Figure 9. Failure mode of SJ-22 (a) Deformation of tenon neck on the upper side (b) Deformation of tenon neck on the lower side.
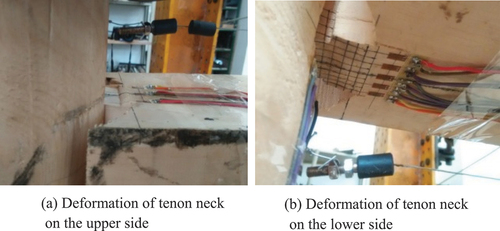
Figure 10. Failure mode of SJ-21 (a) Deformation of tenon neck on the lower side (b) Deformation of tenon neck and tenon forehead on the upper side.
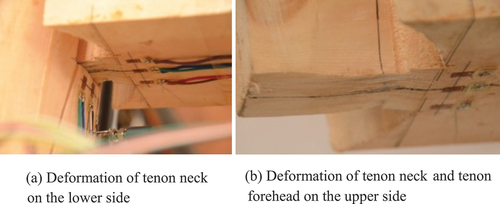
Figure 11. Failure mode of SJ-20.
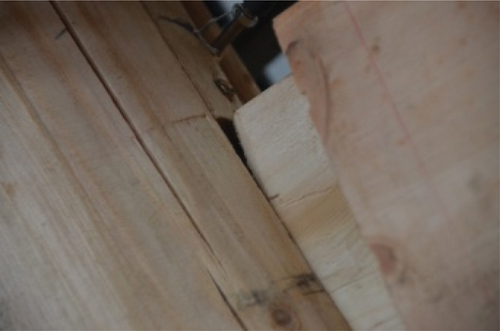
Figure 12. Failure mode of SJ-29 (a) Pulled out of bolts (b) Residual pullout of tenon.
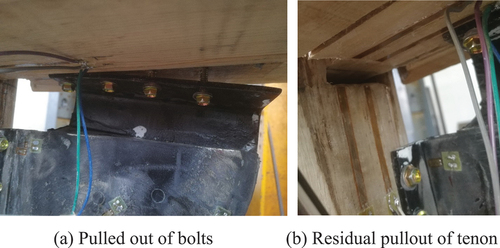
Figure 13. Failure mode of SJ-38 (a) Pulled out of bolts (b) Indentation on the column.
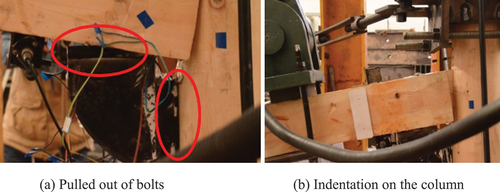
Figure 14. Failure mode of SJ-41.
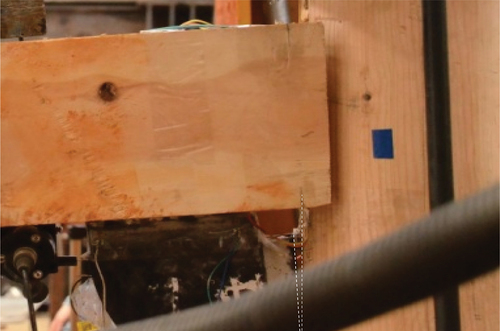
Figure 15. Comparison of hysteresis curves between joint models (a) Loose joint (b) Moderate joint (c) Tight joint.
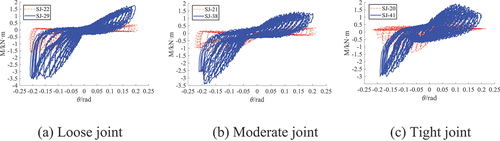
Figure 16. Comparison of the M-θ skeleton curves between the joint models (a) Loose joint (b) Moderate joint (c) Tight joint.
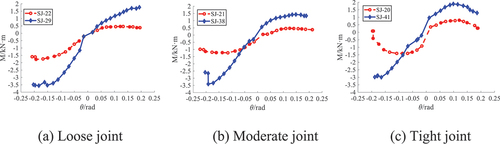
Figure 17. Comparison of the stiffness degradation curves between joint models (a) Loose joint (b) Moderate joint (c) Tight joint.
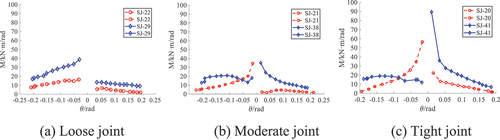
Figure 18. A diagram showing the calculation of he.
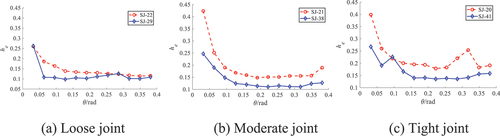
Figure 19. Analysis of equivalent viscous damping coefficient curves in the joint models (a) Loose joint (b) Moderate joint (c) Tight joint.