Figures & data
Figure 1. Localisation of the Giralda tower of the Cathedral of Seville.
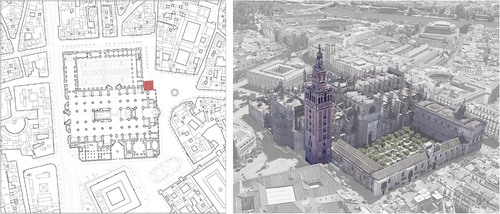
Figure 2. Schematic diagram of the methodology.
Figure 3. Major mosque superimposed on the Gothic Cathedral floor (based on the hypothesis of A. Jimenez and A. Almagro). Photography of the Giralda tower (1) and the induced settlement on the Lagarto” gate (2).
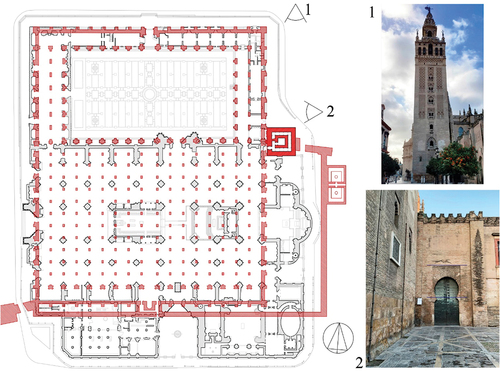
Figure 4. Giralda tower foundation, east façade elevation and plan (based on the archaeological studies carried out by Tabales (Tabales Rodríguez 1998)). North elevation of the Islamic minaret of the Major Mosque (based on the hypothesis of A. Almagro (Almagro-Gorbea and Zúñiga-Urbano Citation2007)(Almagro-Gorbea Citation2012)). Dimensions in metres.
Figure 5. Giralda tower foundation, south and north façade elevation (based on the archaeological studies carried out by Tabales (Tabales-Rodríguez Citation1998)).
Table 1. Pressure applied to the base of the foundation for the construction phases.
Table 2. Stratigraphy of the soil and layer thickness.
Figure 6. Geotechnical profiles (GP) under the tower. Dimensions in metres.
Table 3. Geotechnical properties of the strata.
Table 4. Properties of the foundation base.
Table 5. Settlement for each point and construction phase. Results in centimetres.
Figure 7. Discretisation and measurement points of the 3D FEM.
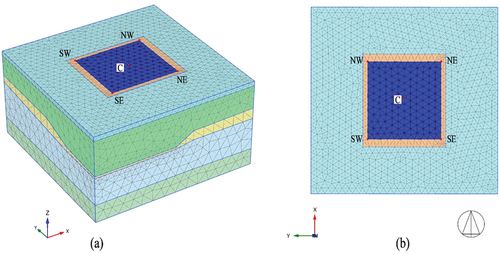
Figure 8. Total mesh displacement of the MC model. Section GP2 (a) and GP4 (b).
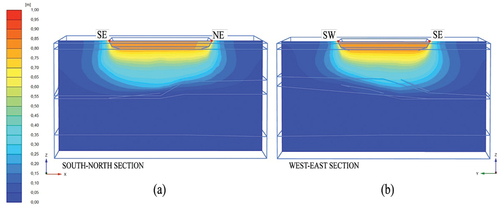
Figure 9. Total displacement of the MC model. Section from the south-east to the north-west corner.
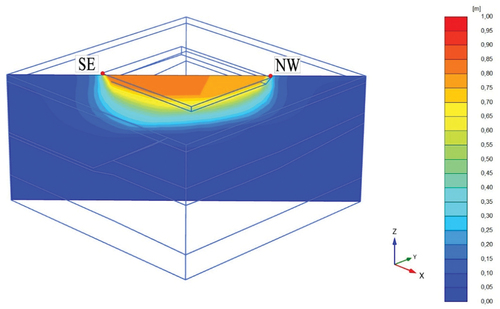
Figure 10. Settlements as a function of time (MC model) (a) All phases using a logarithmic scale (b) Enlargement plot of the construction and consolidation of the Alminar (P4 and P5). (SE, SW, NE and NW points).
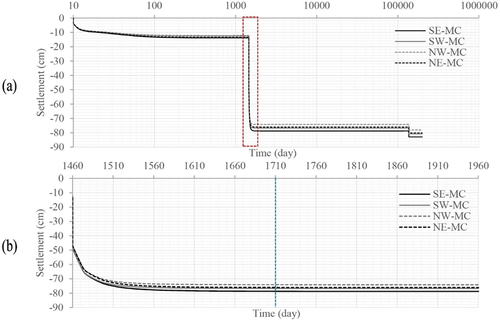
Figure 11. Total displacement of Soft-Soil model. Section north-south (a) and section west-east (b).
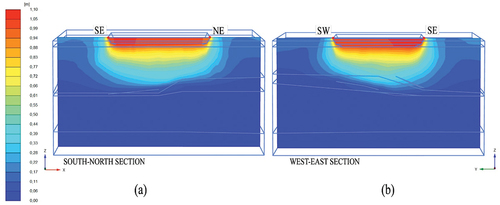
Figure 12. Total displacement for the SS model. Section from the south-east to the north-west corner.
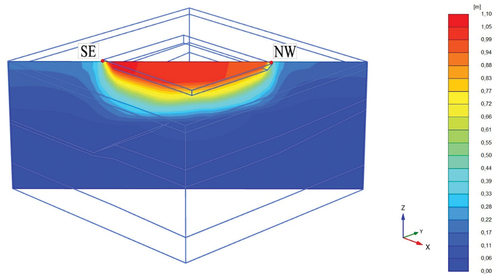
Figure 13. Settlements as a function of time (SS model) (a) All phases using a logarithmic scale (b) Enlargement of the construction (P3) and consolidation of the Alminar (P4) (SE, SW, NE and NW points).
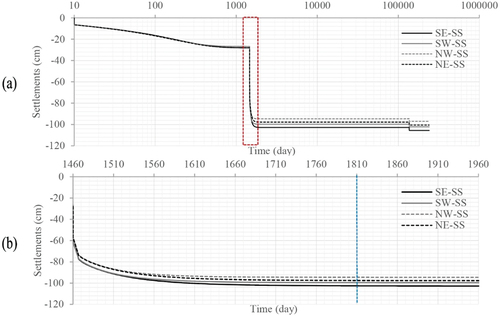
Figure 14. Evolution of the pore pressure excess (KN/m2) measured at an intermediate point of the infill alluvial layer (Level II). (a) All phases using a logarithmic scale (b) Enlargement of the construction (P3) and consolidation of the Alminar (P4).
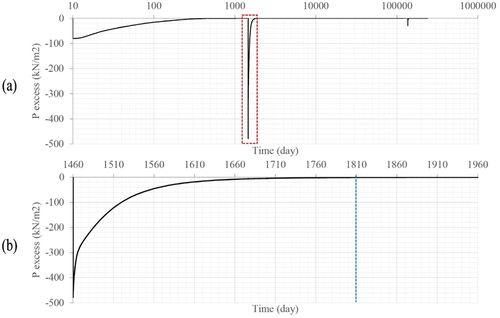
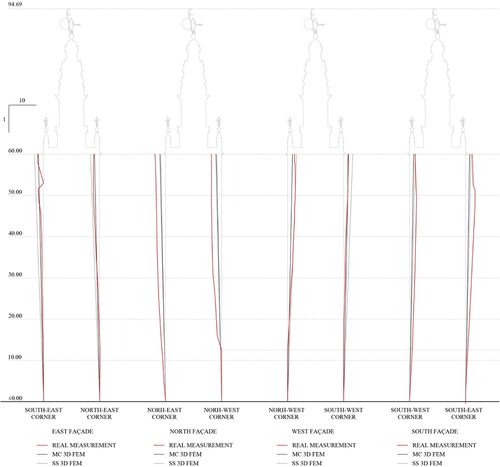
Figure 15. Comparison between the real measurements of the verticality and the inclinations caused by the differential settlements.