Figures & data
Figure 1. Building assessment methodology.
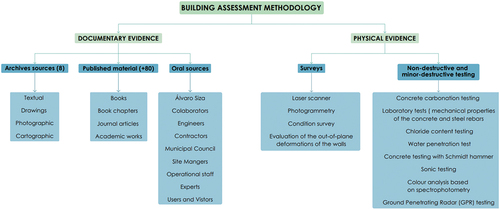
Figure 2. Aerial view of the Ocean Swimming Pool (credits: Pixel).
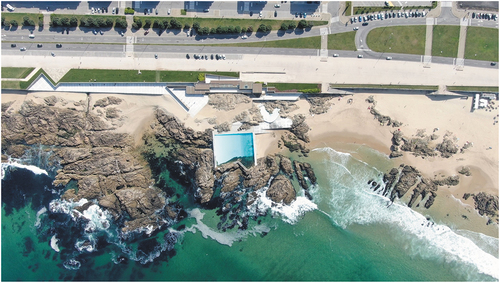
Figure 3. Plan of the Ocean Swimming Pool — Plan of the Ocean Swimming Pool — (1) adults’ swimming pool; (2) children’s swimming pool; (3) entrance ramp; (4) men’s changing rooms; (5); women’s changing rooms; (6) reception; (7) changing rooms hallway; (8) collective changing room; (9) chlorine cabinet; (10) water treatment area; (11) south bathrooms; (12) swimming pools pathways and solarium; (13) south platform; (14) bar; (15) bar’s kitchen; (16) bar’s terrace; (17) security guard’s room; (18) south storage rooms; (19) water collection area; (20) swimming pools’ platform; (21) north platform; (22) north bathrooms; (23) staff’s changing rooms and bathrooms; (24) north storage room; (25) trash storage room.
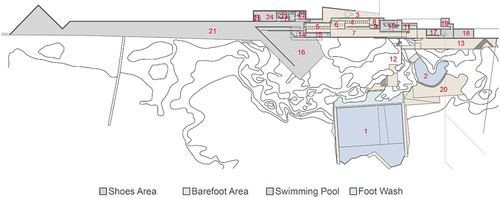
Figure 4. Álvaro Siza, Ocean Swimming Pool design phases: a) Phase 1 (1960–1961) adults’ swimming pool; b) Phase 2 (1962–1965) children’s swimming pool, water treatment facilities, bathrooms and changing rooms; c) Provisional structures to be demolished (1966) bar and bathrooms; d) Phase 3 (1970–1972) north and south platforms, storage rooms, bar and terrace; e) Restaurant (unbuilt).
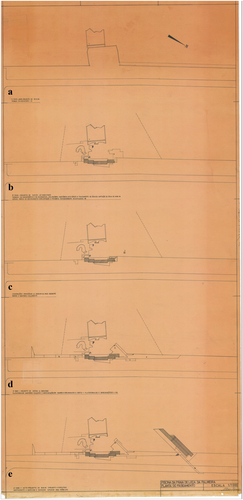
Figure 5. a) Beginning of the construction works in 1961 (first phase); b) Changing room’s building as of 1968 (second phase); c) North extension of the bar (third/fourth phases); d) Recent conservation and extension to the north (2018–2021).
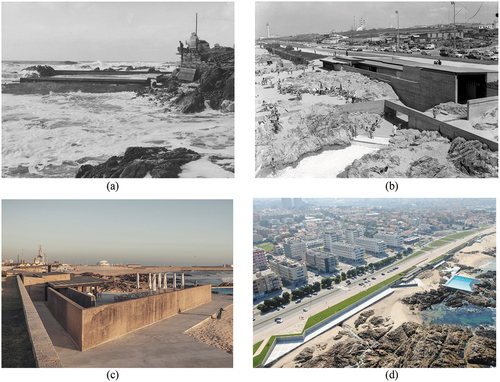
Figure 6. Laser scanner survey and 3D modelling of the building after recent conservation and extension (2018–2021).
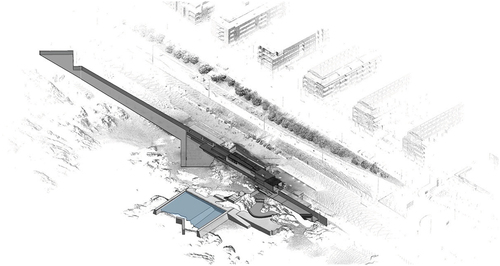
Figure 7. Synthesis of the construction phases — as built (1960–2021).
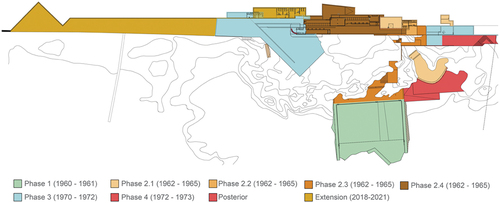
Figure 8. Bernardo Ferrão, Slab for the water treatment area, 1965 (Matosinhos Municipal Council Archive).
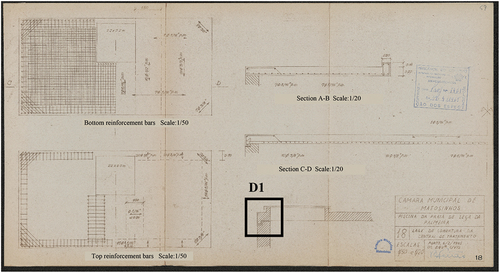
Figure 9. Bernardo Ferrão, Retaining walls, 1966 (Matosinhos Municipal Council Archive).
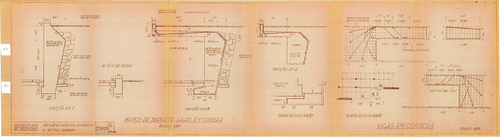
Figure 10. Photographs during construction, 1971 (Mota Citation1972; Centro de Documentação da FAUP).
Figure 11. Locations of the in-situ tests and the extracted samples.
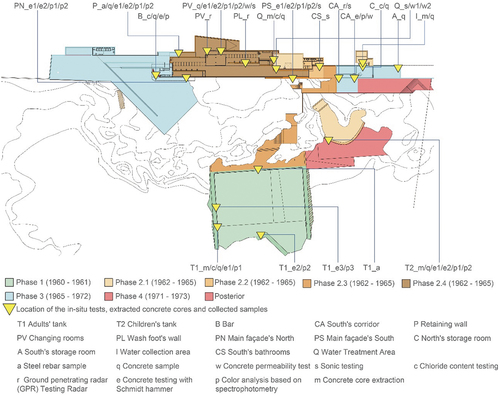
Figure 12. Condition survey mapping.
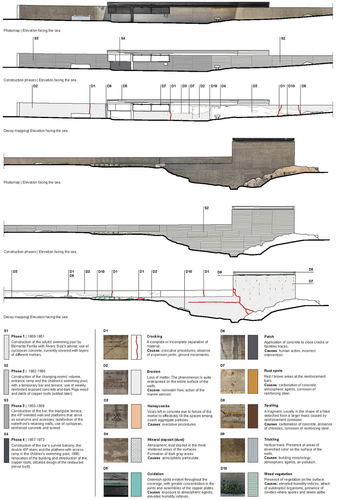
Figure 13. Examples of damage: (a) cracks and repair with the application of mortar; (b) spalling caused by reinforced steel corrosion in a beam; (c) distributed crack pattern; (d) concrete slab severely affected by the corrosion of the reinforced steel.
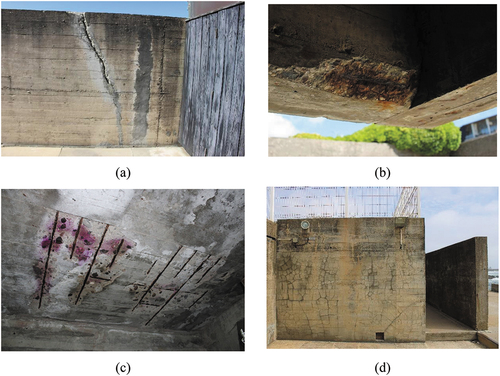
Table 1. Summary of the results of the in-situ and laboratory tests in concrete.
Figure 14. Results of the colour analysis.
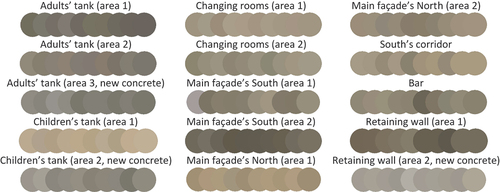
Table 2. Results of the chemical tests to estimate the chloride content in the cement paste.
Figure 15. TGA thermal curves and initial mass of the samples.
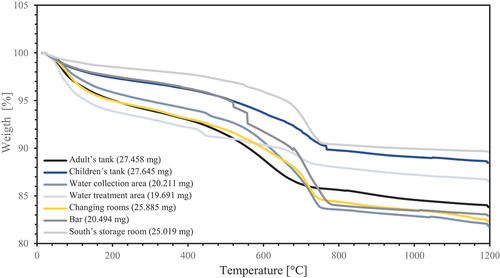
Figure 16. Results of the nanoindentation.
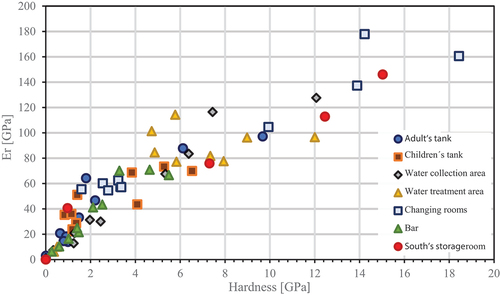
Figure 17. MIP results: logarithmic differential intrusion vs. pore size diameter and porosity.
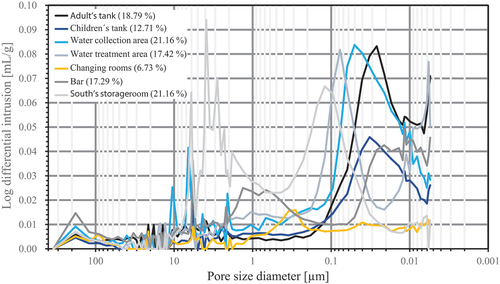
Table 3. Summary of the properties of the steel rebar specimens.
Figure 18. GPR tests on the beam over the changing rooms: (a) location of the GPR profiles; (b) likely reinforcement details of the connection between the beam supported by the two cantilever beams.
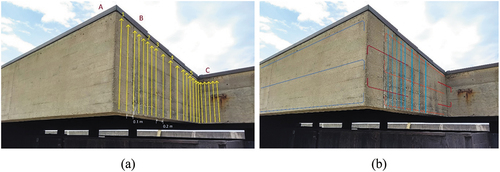
Figure 19. Survey and testing of the timber specimen: (a) cross-section; (b) resistograph result.
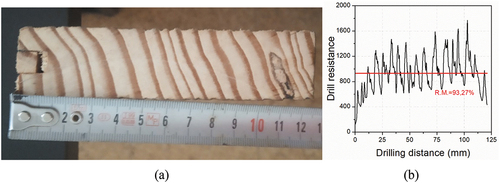
Figure 20. Pilot demonstration of concrete repair: a) Aggregates and pigments for repair mortar; b) Samples for concrete repair (4 of 10); c) R1 before and d) after concrete repair; e) R2 before and f) after concrete repair.
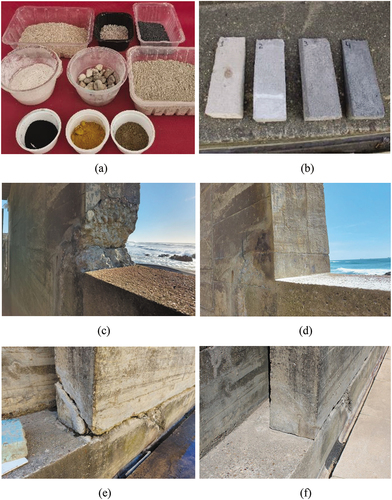
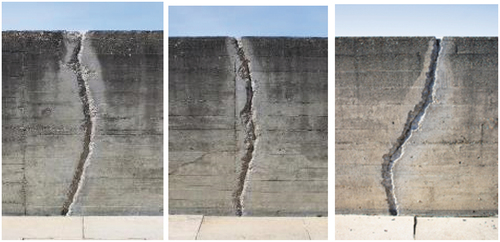
Figure 21. Vertical cracks due to the absence of movement joints after recent conservation by Alvaro Siza (2021).