Figures & data
Table 1. Relative methods for measuring moisture content (BS EN 16,682:2017).
Figure 1. Test results by Hawkins and McConnell (Citation1992) (Reproduced).
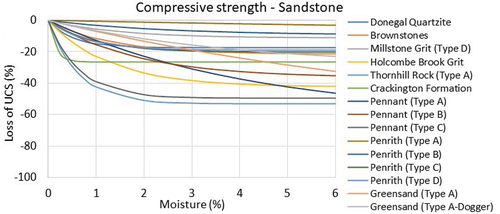
Figure 2. Relationship between the dry and saturated UCS (Vasarhelyi Citation2003).
Figure 3. a) UCS vs moisture content and b) relative UCS vs. water content (Vasarhelyi and Ván Citation2006).
Figure 4. Saturated UCS vs. water absorption (Fahimifar and Soroush Citation2007).
Figure 5. UCSsat vs. UCSdry.
Figure 6. Review of literature and test data (Rabat, Cano, and Tomas Citation2020).
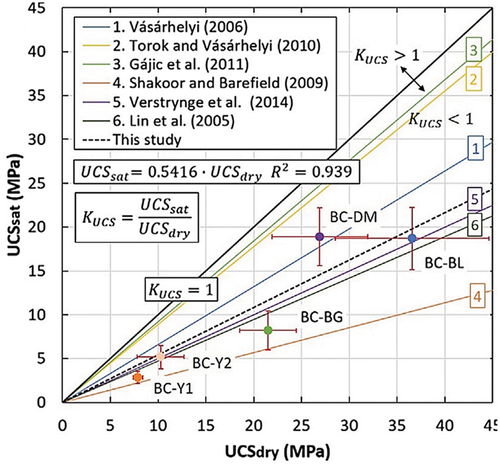
Figure 7. a) Stone appearance and b) micrographic details using cross-polarized light.
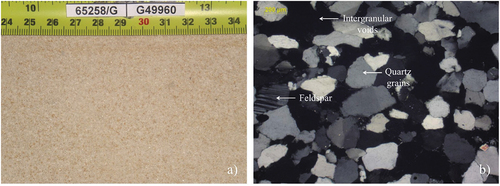
Figure 8. Testing process.
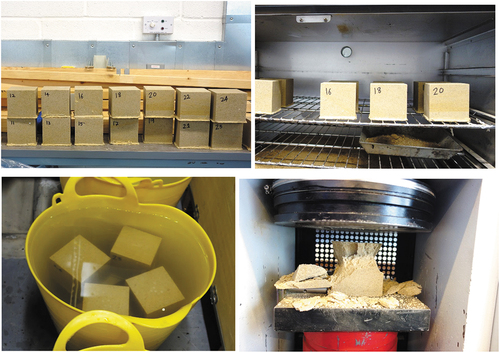
Table 2. Test results.
Figure 9. UCS vs. moisture for test data.
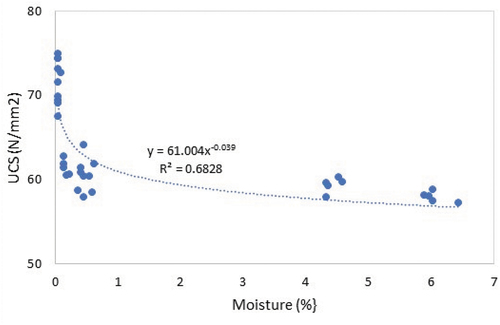
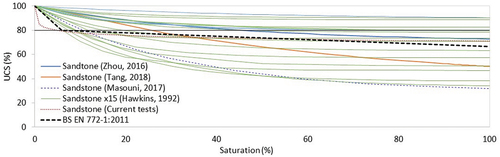
Figure 10. Summary for all data.
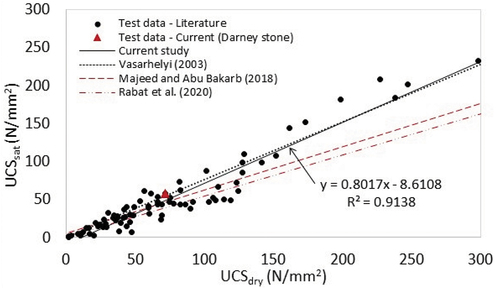
Table 3. Average relationship between UCSsat and UCSdry from literature.
Figure 11. Saturation vs. soaking time.
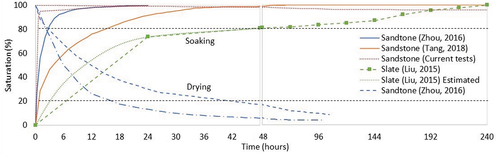
Figure 12. UCS vs. soaking time.
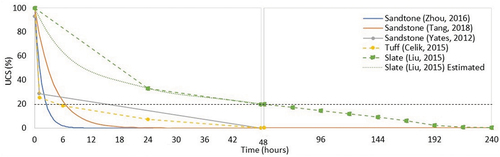
Figure 13. UCS vs. saturation.