Figures & data
Figure 1. Cumulative water absorption rate of both types of bricks determined by Gaggero et al. (Citation2019).
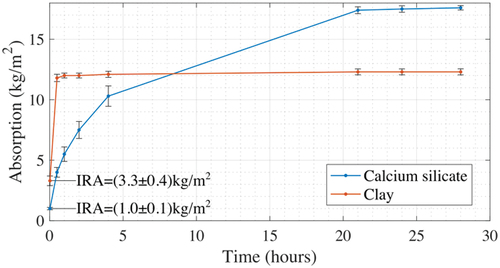
Table 1. Properties of clay and calcium-silicate bricks employed: dimensions, compressive strength, and initial rate of absorption.
Figure 2. (a) Calcium-silicate and (b) clay brick masonry couplets.
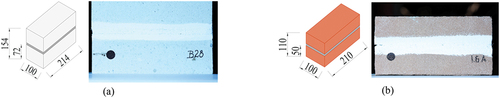
Figure 3. (a) Computer-controlled bond-wrench test set-up used for testing (Gaggero and Esposito Citation2021) with (b) schematic view.
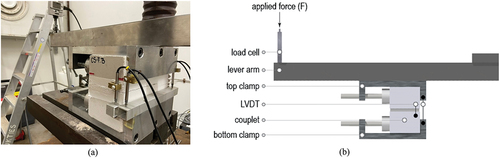
Table 2. Experimental results obtained per set-goal: width of the induced crack (CMOD) and peak force (Fi) measured with the bond-wrench test for cracking cycle i, with relative coefficient of variation specified in brackets (%). The specimen’s type (mortar and brick type) tested, cracking specifics (hardening time at which pre-cracking was carried out, CMOD cracking intensity, i.e. partially or fully separated, and the number of specimens tested) and healing environment used are indicated for each set.
Figure 4. Performance of bio-based couplets built with clay and calcium silicate bricks: (a) peak force after multiple cracking-healing cycles with the relative healing ratio (Fi/F0) computed against the original capacity assessed at 7 days; (b) healing ratio (F2/F0) against the width of the repaired crack.
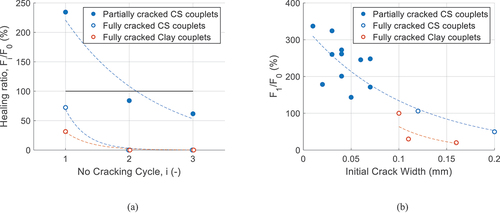
Figure 5. Fully cracked bio-based couplets before and after multiple cracking-healing cycles.
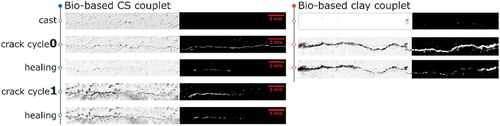
Figure 6. Comparison of peak force recovery across various environments for clay and CS couplets. Mean values derived from five specimens.
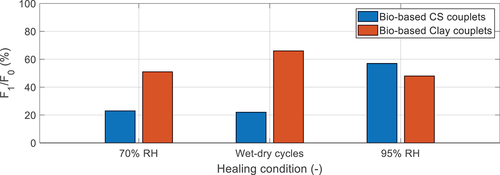
Figure 7. Peak force versus hardening time for bio-based and reference couplets. Each data point is based on mean values of ten specimens.
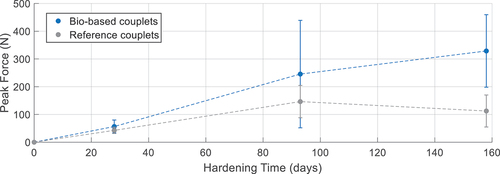
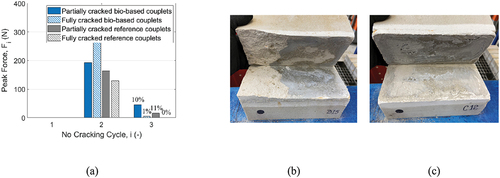
Figure 8. Effectiveness of bio-based couplets compared to reference couplets pre-cracked at 28 days: (a) peak force after multiple cracking-healing cycles with the relative healing ratio (Fi/F0) computed against the original capacity obtained at first cracking cycle; (b) ratio (F2/F0) against the initial crack width, evaluated at the end of the first cracking cycle.
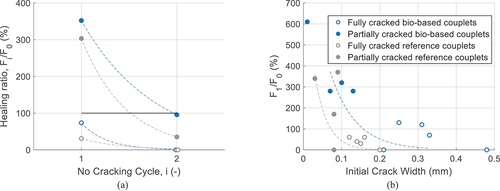
Figure 9. Bio-based and reference couplets before and after the first healing cycle.
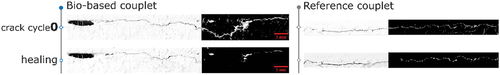
Figure 10. Effectiveness of bio-based couplets compared to reference couplets pre-cracked at 93 days: (a) peak force after multiple cracking-healing cycles with the relative healing ratio (Fi/F0) computed against the original capacity obtained at first cracking cycle; failure mode obtained in (b) self-healing and (c) control couplets at 158 days.