
Figures & data
Figure 1. Hierarchical structure of bones and the theoretical possibility of mimicking it with fibrous replacements. 1 represents mineralized collagen fibrils, 2 refers to a collagen fibril, and 3 shows a collagen molecule. To mimic the size of the collagen structure with the replacement is probably a major challenge. Figure adapted from Jiang et al.,[Citation9] Wang et al.[Citation10] and D’Elia.[Citation128]
![Figure 1. Hierarchical structure of bones and the theoretical possibility of mimicking it with fibrous replacements. 1 represents mineralized collagen fibrils, 2 refers to a collagen fibril, and 3 shows a collagen molecule. To mimic the size of the collagen structure with the replacement is probably a major challenge. Figure adapted from Jiang et al.,[Citation9] Wang et al.[Citation10] and D’Elia.[Citation128]](/cms/asset/242b9bb2-232c-4841-ac52-15de886ce99b/lmsc_a_2076693_f0001_c.jpg)
Table 1. General chemical structure of PHAs, examples of specific polymers and copolymers.
Table 2. Chemical structures of selected copolymers, m = repeat unit of the hydroxybutyrate block, p = repeat unit of copolymer block.
Table 3. Selected material properties of some PHAs compared with polypropylene.
Figure 2. Schematic drawing of a melt-spinning facility.
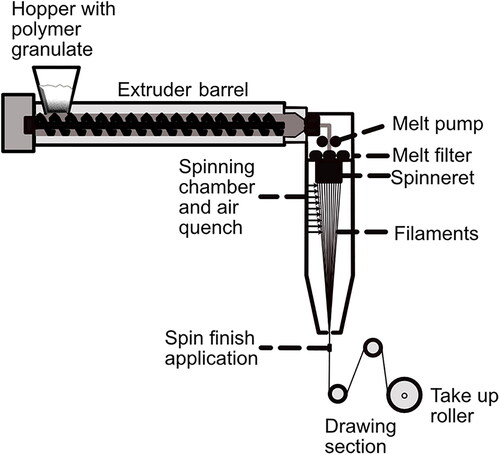
Figure 3. Schematic drawing of a wet-spinning facility.
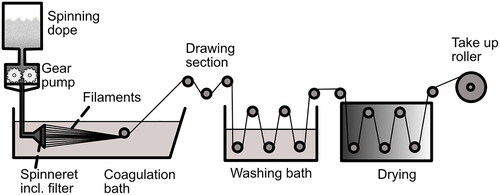
Figure 4. Tensile strength and elongation at break of melt spun P3HB filaments at different draw ratios.
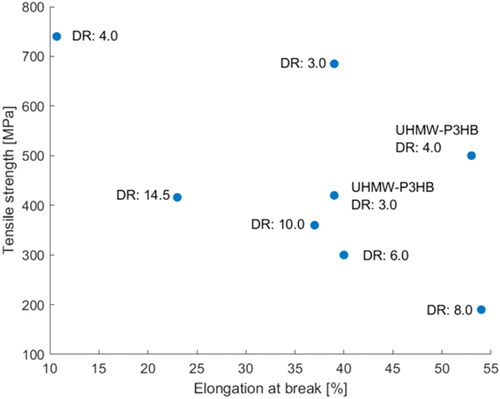
Figure 5. Tensile strength and elongation at break of different melt spun PHA filaments.
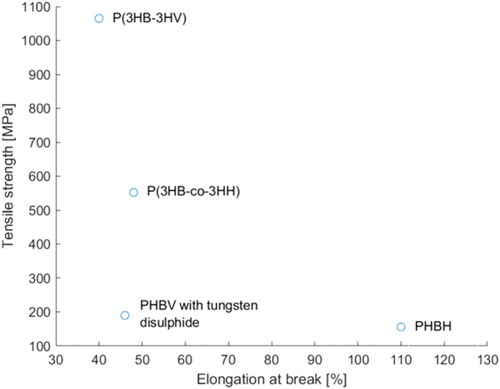
Table 4. Maximum mechanical properties achieved by melt spinning.
Figure 6. Scheme of the crystalline changes during quenching, drawing, and annealing procedure. The red boxes in the last step represent the α-structures formed while the zigzag lines represent the β-crystals formed. Figure adapted from Tanaka et al.[Citation107]
![Figure 6. Scheme of the crystalline changes during quenching, drawing, and annealing procedure. The red boxes in the last step represent the α-structures formed while the zigzag lines represent the β-crystals formed. Figure adapted from Tanaka et al.[Citation107]](/cms/asset/9ce22366-d34b-4733-9a3d-0577167fb487/lmsc_a_2076693_f0006_c.jpg)
Table 5. Overview (syringe) wet spinning.
Figure 7. Scanning electron microscope images of the top (left column) and cross-sectional view (right column) of a PHBHHx (A) and PHBHHx/poly(ε-caprolactone) (PCL) scaffold at different ratios. (B) PHBHHx/PCL 3:1 (C) PHBHHx/PCL 2:1, (D) PHBHHx/PCL 1:1. The high magnification insets show the porosity (left) as well as cross-section (right) of single fibers. Images were taken from Puppi et al.[Citation53] without any modification and licensed under CC BY 4.0.
![Figure 7. Scanning electron microscope images of the top (left column) and cross-sectional view (right column) of a PHBHHx (A) and PHBHHx/poly(ε-caprolactone) (PCL) scaffold at different ratios. (B) PHBHHx/PCL 3:1 (C) PHBHHx/PCL 2:1, (D) PHBHHx/PCL 1:1. The high magnification insets show the porosity (left) as well as cross-section (right) of single fibers. Images were taken from Puppi et al.[Citation53] without any modification and licensed under CC BY 4.0.](/cms/asset/e19afccf-7720-4ab9-90e3-94423c86c8bb/lmsc_a_2076693_f0007_b.jpg)
Figure 8. Confocal laser scanning microscopy microphotographs of PHBHHx and PHBHHx/PCL scaffolds, showing MC3T3-E1 cells cultured on the surface after 7, 14, 21 and 28 days of cell culture. Images were taken from Puppi et al.[Citation53] without any modification and licensed under CC BY 4.0.
![Figure 8. Confocal laser scanning microscopy microphotographs of PHBHHx and PHBHHx/PCL scaffolds, showing MC3T3-E1 cells cultured on the surface after 7, 14, 21 and 28 days of cell culture. Images were taken from Puppi et al.[Citation53] without any modification and licensed under CC BY 4.0.](/cms/asset/5b09d0c1-48a0-4b66-8735-842e523b6177/lmsc_a_2076693_f0008_c.jpg)