Figures & data
Figure 1. Analysis of 5-methylcytosine (5mC) content in WM266–4 cells by flow cytometry. Asynchronous WM266–4 melanoma cells were labeled with anti-5mC monoclonal antibody prior to DNA staining with propidium iodide (PI). For flow cytometry analysis, cells were selected according to their FSC and SSC parameters (R1 region) (A) and then gated on their PI content (R2 region) (B). 5mC labeling of the R2 cells (gray histogram) and its isotypic control (black histogram) are displayed on a fluorescence histogram with a linear scale (C). Analysis of cell cycle (D) is combined with analysis of DNA methylation, as shown on the dot plot in (E). The graph (F) reports the mean of fluorescence intensities of 5mC (anti-5mC antibody mfi minus isotype control mfi) and PI measured in contiguous intervals (5000 mfi units) on the PI scale.
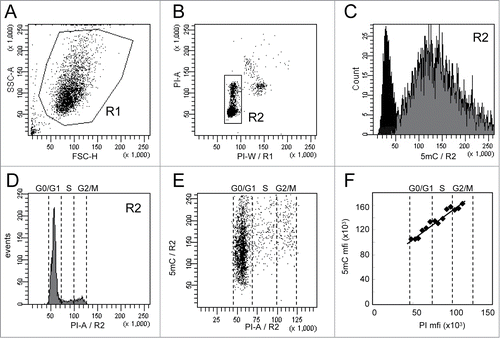
Figure 2. Comparative analysis of total 5-methylcytosine (5mC) content in cell lines by flow cytometry. WM266–4 melanoma and KG1 leukemia cells were labeled with anti-5mC monoclonal antibody prior to DNA staining with propidium iodide (PI). (A). DNA contents in G0/G1 cells were expressed as PI mfis. (B). 5mC contents in G0/G1 cells were expressed as in (C). 5mC/DNA indexes were calculated as ratios of 5mC mfis vs. PI mfis. (D). Percentages of 5mC among total cytosines were measured by LC-ESI MS/MS.
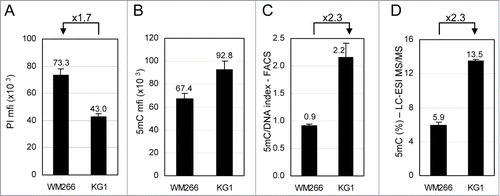
Figure 3. Variations of 5mC content in WM266–4 and KG1 cells upon 5AzadC treatment. WM266–4 cells (A, C, E) and KG1 cells (B, D, F) were seeded at day 0 and treated daily during 3 d with increasing concentrations of 5AzadC. At day 4, cells were collected and numbered (A and B). Samples were analyzed for their 5mC content either by 5mC labeling and FACS analysis (C and D) or by LC-ESI-MS/MS (E and F). 5mC contents, calculated as in are reported as percentages of the 5mC content in untreated cells. * P < 0.05, ** P < 0.01, *** P < 0.005.
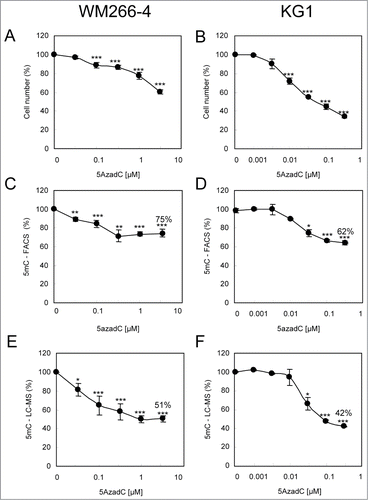
Figure 4. Variations of the 5mC content according to cell cycle status in WM266–4 and KG1 cells upon 5AzadC treatment. WM266–4 cells (A and C) and KG1 cells (B and D) were treated with increasing concentrations of 5AzadC as described in . At day 4, cells were analyzed for their 5mC content by FACS analysis according to their cell cycle status. Black circles are for total cells (R2). Black, gray and white triangles are for G0/G1, S and G2/M cells respectively. The 5mC mfis are calculated as in and reported to the 5mC mfi measured on the G0/G1 cells in the control samples.
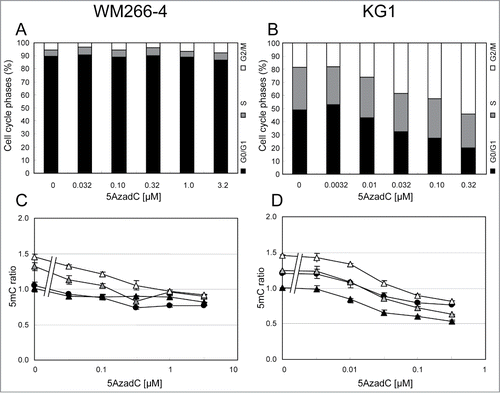
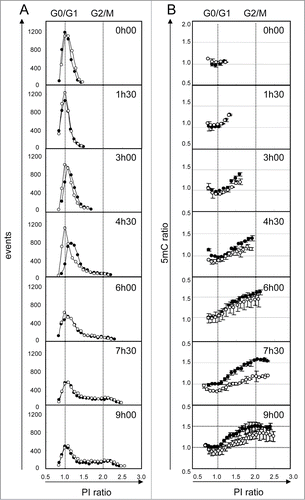
Figure 5. Kinetics of DNA demethylation after 5AzadC treatment in WM266–4 cells. Synchronized WM266–4 cells were treated (white circles) or not (black circles) with 5AzadC (0.32 μM) and collected repetitively at intervals of 90 min. For each sample analysis, the number of cells (column A) and their 5mC labeling (column B) were measured taking 20 contiguous regions according to their PI labeling (intervals of 5000 mfi units). PI and 5mC ratios were calculated using normalized data, as the means of sample fluorescence intensities (mfi) reported to the mfi measured in G0/G1 cells (peak point) in untreated cells at t0. Each circle represents mfis of at least 50 cells. 5mC ratios are reported as means of 2 independent experiments.