1,894
Views
13
CrossRef citations to date
0
Altmetric
Research Paper

EGFR promoter exhibits dynamic histone modifications and binding of ASH2L and P300 in human germinal matrix and gliomas

, , , &
Pages 496-507 | Received 06 Feb 2015, Accepted 13 Apr 2015, Published online: 21 May 2015

Figures & data

Figure 1. EGFR expression analysis in the developing and adult human SVZ and in gliomas. (A, B) Immunohistochemical (IHC) analysis of EGFR expression in non-neoplastic tissues reveals strong immunoreactivity throughout the fetal germinal matrix (GM) (score (Sc) 3 in 80%) and infant subventricular zone (SVZ) where it localizes to the astrocytic ribbon (AR) (Sc of 3 in 100%). In the adult SVZ, moderate band-like immunoreactivity is seen throughout the AR, with strongly positive membranous staining around some cells within it (inset). In the adult white matter (WM), only rare, weakly stainined cytoplasmic processes are visible, typically in association with blood vessels. Ependymal cell layer (E) indicates the beginning of the GM/ SVZ. Traversing EGFR-positive processes between the astrocytic ribbon and the ependymal surface are noted as arrows. In gliomas, both LGG and HGG show strong immunoreactivity for EGFR (Sc of 3 in ∼50% and ∼80%, respectively). Scale bar = 100 μM (20X objective). Distribution of EGFR protein expression is evaluated by semiquantitative IHC scoring as previously defined.Citation19 The presence of membraneous and cytoplasmic staining is scored on a scale from 0 (no staining) to 3 (strong staining) in adult Cd (n = 5), fetal GM (n = 5), infant SVZ at AR (n = 6), adult SVZ at AR (n = 5), adult WM (n = 5), LGG (n = 44), and HGG (n = 43). (C) The changes of EGFR mRNA expression parallel those for its protein, with significantly higher levels of EGFR in fetal GM, LGG gliomas, and HGG gliomas, compared to adult Cx and adult WM. EGFR mRNA levels are expressed as average Log2 fold change over Cx ± SE, with statistical significance relative to adult Cx (##P < 0.01; ### P < 0.001), adult WM (*P < 0.05; *** P < 0.001; one-tailed t test: *’ P < 0.05), and adult SVZ (^^P < 0.01).
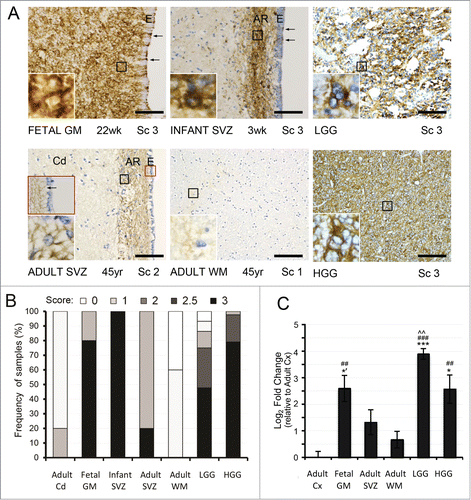
Figure 1. EGFR expression analysis in the developing and adult human SVZ and in gliomas. (A, B) Immunohistochemical (IHC) analysis of EGFR expression in non-neoplastic tissues reveals strong immunoreactivity throughout the fetal germinal matrix (GM) (score (Sc) 3 in 80%) and infant subventricular zone (SVZ) where it localizes to the astrocytic ribbon (AR) (Sc of 3 in 100%). In the adult SVZ, moderate band-like immunoreactivity is seen throughout the AR, with strongly positive membranous staining around some cells within it (inset). In the adult white matter (WM), only rare, weakly stainined cytoplasmic processes are visible, typically in association with blood vessels. Ependymal cell layer (E) indicates the beginning of the GM/ SVZ. Traversing EGFR-positive processes between the astrocytic ribbon and the ependymal surface are noted as arrows. In gliomas, both LGG and HGG show strong immunoreactivity for EGFR (Sc of 3 in ∼50% and ∼80%, respectively). Scale bar = 100 μM (20X objective). Distribution of EGFR protein expression is evaluated by semiquantitative IHC scoring as previously defined.Citation19 The presence of membraneous and cytoplasmic staining is scored on a scale from 0 (no staining) to 3 (strong staining) in adult Cd (n = 5), fetal GM (n = 5), infant SVZ at AR (n = 6), adult SVZ at AR (n = 5), adult WM (n = 5), LGG (n = 44), and HGG (n = 43). (C) The changes of EGFR mRNA expression parallel those for its protein, with significantly higher levels of EGFR in fetal GM, LGG gliomas, and HGG gliomas, compared to adult Cx and adult WM. EGFR mRNA levels are expressed as average Log2 fold change over Cx ± SE, with statistical significance relative to adult Cx (##P < 0.01; ### P < 0.001), adult WM (*P < 0.05; *** P < 0.001; one-tailed t test: *’ P < 0.05), and adult SVZ (^^P < 0.01).

Figure 2. Conserved patterns of DNA methylation at the EGFR promoter in acutely isolated human neural cells and in gliomas. (A) DNA hypermethylation at the EGFR CpG island shore (EGFR5up) and DNA hypomethylation at the CpG island spanning the EGFR promoter (EGFRprom) are noted across EGFR-positive and EGFR-negative neural populations (EGFR-pos and EGFR-neg) and in low- and high-grade glioma samples (LGG and HGG). Artificially bisulfite-methylated DNA serves as positive control at EGFR. (B) Variable diversity with higher levels of DNA methylation is seen across samples at the MGMT (-528 to -382 from TSS) and LINE1 (-327 to -27 from TSS) promoters, compared to the EGFR CpG island (-604 to 311 from TSS).
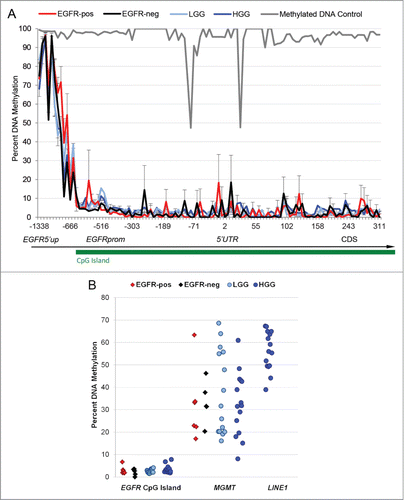
Figure 2. Conserved patterns of DNA methylation at the EGFR promoter in acutely isolated human neural cells and in gliomas. (A) DNA hypermethylation at the EGFR CpG island shore (EGFR5′up) and DNA hypomethylation at the CpG island spanning the EGFR promoter (EGFRprom) are noted across EGFR-positive and EGFR-negative neural populations (EGFR-pos and EGFR-neg) and in low- and high-grade glioma samples (LGG and HGG). Artificially bisulfite-methylated DNA serves as positive control at EGFR. (B) Variable diversity with higher levels of DNA methylation is seen across samples at the MGMT (-528 to -382 from TSS) and LINE1 (-327 to -27 from TSS) promoters, compared to the EGFR CpG island (-604 to 311 from TSS).

Figure 3. Dynamic histone modifications at the EGFR promoter in developing and adult SVZ and in gliomas. (A) The activating mark H3K27ac is significantly enriched at the EGFR promoter region (EGFRprom) and to a lesser extent at the CpG island shore (EGFR5up) in fetal GM, adult SVZ, and LGG gliomas, compared to adult WM. The second intron of EGFR (EGFRIn2) represents internal negative control as a region lacking H3K27ac and H3K4me3 in a wide range of cell lines deposited in the ENCODE database. The 5′UTR of the housekeeping gene B2M represents positive control as a region showing high enrichment of H3K27ac and H3K4me3 in a wide range of cell lines in the ENCODE database and published.Citation43,49-51,83 IgG pull-down represents non-specific binding. (B) Significant enrichment of H3K4me3 is seen in fetal GM, adult SVZ, HGG, and LGG compared to adult WM. In A-B, the data is expressed as average of percent enrichment over input ± SE, with statistical significance relative to adult WM (*P < 0.05; ** P < 0.01; *** P < 0.001; one-tailed t test: *’ P < 0.05).
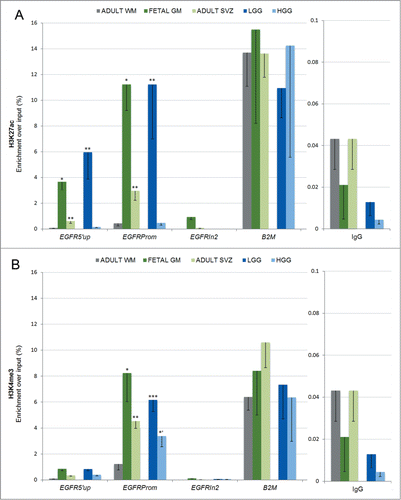
Figure 3. Dynamic histone modifications at the EGFR promoter in developing and adult SVZ and in gliomas. (A) The activating mark H3K27ac is significantly enriched at the EGFR promoter region (EGFRprom) and to a lesser extent at the CpG island shore (EGFR5′up) in fetal GM, adult SVZ, and LGG gliomas, compared to adult WM. The second intron of EGFR (EGFRIn2) represents internal negative control as a region lacking H3K27ac and H3K4me3 in a wide range of cell lines deposited in the ENCODE database. The 5′UTR of the housekeeping gene B2M represents positive control as a region showing high enrichment of H3K27ac and H3K4me3 in a wide range of cell lines in the ENCODE database and published.Citation43,49-51,83 IgG pull-down represents non-specific binding. (B) Significant enrichment of H3K4me3 is seen in fetal GM, adult SVZ, HGG, and LGG compared to adult WM. In A-B, the data is expressed as average of percent enrichment over input ± SE, with statistical significance relative to adult WM (*P < 0.05; ** P < 0.01; *** P < 0.001; one-tailed t test: *’ P < 0.05).

Figure 4. The EGFR promoter is a direct in vivo target of P300 and ASH2L during neural development and in gliomas. The histone modifiers P300 and ASH2L show significant binding above IgG background at the EGFR promoter in fetal germinal matrix and in LGG and HGG gliomas compared to adult WM, in correlation with the respectively enriched H3K27ac and H3K4me3 histone marks in these tissues. Data is expressed as average fold change enrichment over IgG ± SE with statistical signficance relative to adult WM (*P < 0.05; one-tailed t-test: *’ P < 0.05).
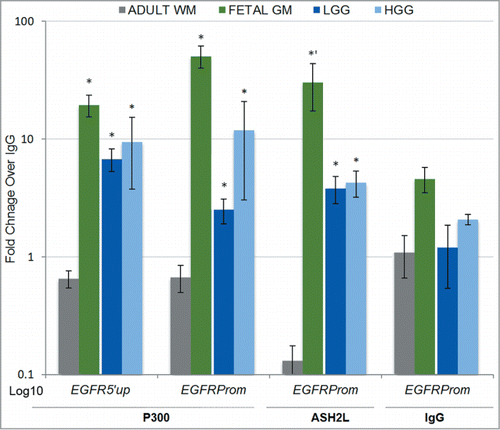
Figure 4. The EGFR promoter is a direct in vivo target of P300 and ASH2L during neural development and in gliomas. The histone modifiers P300 and ASH2L show significant binding above IgG background at the EGFR promoter in fetal germinal matrix and in LGG and HGG gliomas compared to adult WM, in correlation with the respectively enriched H3K27ac and H3K4me3 histone marks in these tissues. Data is expressed as average fold change enrichment over IgG ± SE with statistical signficance relative to adult WM (*P < 0.05; one-tailed t-test: *’ P < 0.05).
Supplemental material

Supplemental_Material.docx

Download MS Word (22.4 MB)

Reprints and Corporate Permissions

Please note: Selecting permissions does not provide access to the full text of the article, please see our help page How do I view content?

To request a reprint or corporate permissions for this article, please click on the relevant link below:

Academic Permissions

Please note: Selecting permissions does not provide access to the full text of the article, please see our help page How do I view content?

Obtain permissions instantly via Rightslink by clicking on the button below:

If you are unable to obtain permissions via Rightslink, please complete and submit this Permissions form. For more information, please visit our Permissions help page.