2,773
Views
101
CrossRef citations to date
0
Altmetric
Research Paper

Differential DNA methylation in umbilical cord blood of infants exposed to mercury and arsenic in utero

, , , , , & show all
Pages 508-515 | Received 27 Feb 2015, Accepted 22 Apr 2015, Published online: 22 May 2015

Figures & data

Table 1. Selected maternal and infant characteristics and Hg and As concentrations

Table 2. EstimatedFootnotea change in the proportion of leukocyte composition (95% CI) in cord blood in relationship to log2 toenail Hg concentrations

Figure 1. Differentially methylated loci based on maternal toenail Hg. (A) Volcano plot for the relationship between log2 toenail Hg on DNA methylation at all 348,569 CpGs analyzed. Red and blue lines indicate −log10(1 × 10⁻⁴) and −log10(0.05) P-values, respectively. Colors: Yellow=CpG island, Black=CpG Shore, Blue=Shelfs and Open sea. Symbols: Circle = Infinium Type II, Square = Infinium Type I (B) Location of the top 100-CpGs on the basis of P-values compared to all CpGs on the methylation array. Among the top 100 CpGs with lowest P-value, there was a significant enrichment in the N. Shore regions of CpG islands (P = 0.049).
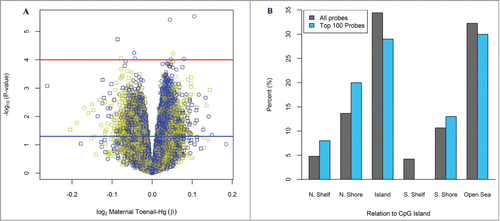
Figure 1. Differentially methylated loci based on maternal toenail Hg. (A) Volcano plot for the relationship between log2 toenail Hg on DNA methylation at all 348,569 CpGs analyzed. Red and blue lines indicate −log10(1 × 10⁻⁴) and −log10(0.05) P-values, respectively. Colors: Yellow=CpG island, Black=CpG Shore, Blue=Shelfs and Open sea. Symbols: Circle = Infinium Type II, Square = Infinium Type I (B) Location of the top 100-CpGs on the basis of P-values compared to all CpGs on the methylation array. Among the top 100 CpGs with lowest P-value, there was a significant enrichment in the N. Shore regions of CpG islands (P = 0.049).

Figure 2. Differentially methylated loci based on the interaction between maternal toenail Hg and urinary As. (A) Volcano plot for the relationship between the multiplicative interaction of log2 toenail Hg and log2 urinary As on DNA methylation at all 348,569 CpGs analyzed. Red and blue lines indicate −log10(1 × 10⁻⁴) and −log10(0.05) P-values, respectively. Colors: Yellow = CpG island, Black = CpG Shore, Blue=Shelfs and Open sea. Symbols: Circle = Infinium Type II, Square = Infinium Type I (B) Location of the top 100-CpGs on the basis of P-values compared to all CpGs on the methylation array. Among the top 100 CpGs with lowest P-value, there was a significant enrichment of CpG islands (P = 0.045) and S. Shore regions (P = 0.009).
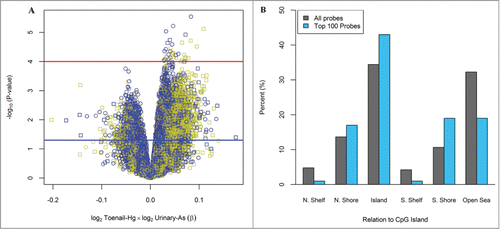
Figure 2. Differentially methylated loci based on the interaction between maternal toenail Hg and urinary As. (A) Volcano plot for the relationship between the multiplicative interaction of log2 toenail Hg and log2 urinary As on DNA methylation at all 348,569 CpGs analyzed. Red and blue lines indicate −log10(1 × 10⁻⁴) and −log10(0.05) P-values, respectively. Colors: Yellow = CpG island, Black = CpG Shore, Blue=Shelfs and Open sea. Symbols: Circle = Infinium Type II, Square = Infinium Type I (B) Location of the top 100-CpGs on the basis of P-values compared to all CpGs on the methylation array. Among the top 100 CpGs with lowest P-value, there was a significant enrichment of CpG islands (P = 0.045) and S. Shore regions (P = 0.009).
Supplemental material

Supplemental_Material.zip

Download Zip (223 KB)

Reprints and Corporate Permissions

Please note: Selecting permissions does not provide access to the full text of the article, please see our help page How do I view content?

To request a reprint or corporate permissions for this article, please click on the relevant link below:

Academic Permissions

Please note: Selecting permissions does not provide access to the full text of the article, please see our help page How do I view content?

Obtain permissions instantly via Rightslink by clicking on the button below:

If you are unable to obtain permissions via Rightslink, please complete and submit this Permissions form. For more information, please visit our Permissions help page.