1,823
Views
26
CrossRef citations to date
0
Altmetric
Research Paper

Epigenetic silencing of neurofilament genes promotes an aggressive phenotype in breast cancer

, , , , , , , , , , , , , , , & show all
Pages 622-632 | Received 12 Feb 2015, Accepted 04 May 2015, Published online: 26 Jun 2015

Figures & data

Figure 1. Silencing of NEFH is associated with DNA promoter hypermethylation or repressive chromatin structure. (A) Appearance of NEFH within the breast cancer hypermethylome. Cell lines were treated with either 5 μmol/L DAC for 96 hours or 300 nmol/L TSA for 18 hours. Gene expression changes (analyzed on 4 × 44 K Agilent platform) are plotted by fold change (log scale) after DAC (y-axis) or TSA (x-axis) treatment. (B) Expression (mRNA) of NEFH in untreated (Mock), DAC (5 μmol/L 96 hours) or TSA (300 nmol/L18 hours) treated MDA-MB-231 and MCF7 cells as well as in untreated MCF10A and HMEC cells or normal breast (NB). (C) Methylation status of the NEFH region from +41 to +198 relative to transcription start site (TSS) in cells without treatment (Mock) or cells treated with DAC or TSA assessed by MSP. U and M marking unmethylated and methylated bands, respectively. DKO and IVD were used as control for unmethylated and methylated DNA, respectively. (D) ChIP at the NEFH promoter region from +125 bp to +296 bp relative to TSS for α-H3k4me2 and α-H3k27me3. All values are corrected for IgG background and are normalized to the relative amount of Input obtained by real-time PCR from 2 independent experiments ± SEM. Group comparisons were carried out using Student t test, P***< 0.001 and P*< 0.05.
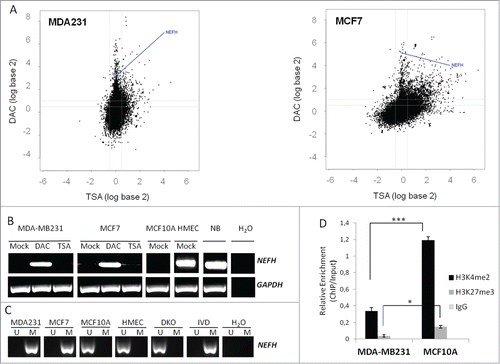
Figure 1. Silencing of NEFH is associated with DNA promoter hypermethylation or repressive chromatin structure. (A) Appearance of NEFH within the breast cancer hypermethylome. Cell lines were treated with either 5 μmol/L DAC for 96 hours or 300 nmol/L TSA for 18 hours. Gene expression changes (analyzed on 4 × 44 K Agilent platform) are plotted by fold change (log scale) after DAC (y-axis) or TSA (x-axis) treatment. (B) Expression (mRNA) of NEFH in untreated (Mock), DAC (5 μmol/L 96 hours) or TSA (300 nmol/L18 hours) treated MDA-MB-231 and MCF7 cells as well as in untreated MCF10A and HMEC cells or normal breast (NB). (C) Methylation status of the NEFH region from +41 to +198 relative to transcription start site (TSS) in cells without treatment (Mock) or cells treated with DAC or TSA assessed by MSP. U and M marking unmethylated and methylated bands, respectively. DKO and IVD were used as control for unmethylated and methylated DNA, respectively. (D) ChIP at the NEFH promoter region from +125 bp to +296 bp relative to TSS for α-H3k4me2 and α-H3k27me3. All values are corrected for IgG background and are normalized to the relative amount of Input obtained by real-time PCR from 2 independent experiments ± SEM. Group comparisons were carried out using Student t test, P***< 0.001 and P*< 0.05.

Figure 2. Methylation of neurofilament genes NEFH, NEFL and NEFM is frequent in breast primary tumors. (A) Methylation and quantitative mRNA expression of NEFH, NEFL and NEFM in 10 breast primary tumors (from 1T to 10T). Methylation status was assayed by MSP for the NEFH region from +41 to +198, for the NEFL region from +86 to +167 and for the NEFM region from +60 to +150 relative to TSS. U and M marking unmethylated and methylated bands, respectively. Quantitative mRNA expression in tumors is shown in fold change (log2) relative to expression in normal breast tissue. (B) Expression (mRNA) of NEFH, NEFL, NEFM and GAPDH in 5 normal breast tissues from non-cancer patients. (C) DNA methylation frequency (in %) of NEFH, NEFL, and NEFM were assessed in a cohort of 14 normal breast tissues from non-cancer patients and in a cohort of 185 primary breast cancers (BC) of stages 0 (DCIS) to 4. DNA methylation frequencies are plotted by tumor stage and are shown as an overall result. (D) Bisulfite sequencing of the NEFH region from −20 bp to +320, the NEFL region from −10 bp to +290 bp and the NEFM region from −140 bp to +240 bp relative to the TSS. Five sequencing reactions are shown for each sample representing clonal plasmids. White and black circles represent unmethylated and methylated CpG dinucleotides, respectively. NB presented the lowest methylation frequency ranging from 3.6% to 16.5% among the 3 genes on bisulfite sequencing. MCF-7 showed a high methylation frequency with almost every CpG methylated for the 3 genes while HMECs showed low methylation frequencies ranging from 11% to 25%. Breast primary tumor sample BC73 showed a methylation frequency ranging from 48% to 60% among the 3 genes.
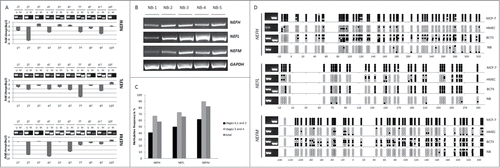
Figure 2. Methylation of neurofilament genes NEFH, NEFL and NEFM is frequent in breast primary tumors. (A) Methylation and quantitative mRNA expression of NEFH, NEFL and NEFM in 10 breast primary tumors (from 1T to 10T). Methylation status was assayed by MSP for the NEFH region from +41 to +198, for the NEFL region from +86 to +167 and for the NEFM region from +60 to +150 relative to TSS. U and M marking unmethylated and methylated bands, respectively. Quantitative mRNA expression in tumors is shown in fold change (log2) relative to expression in normal breast tissue. (B) Expression (mRNA) of NEFH, NEFL, NEFM and GAPDH in 5 normal breast tissues from non-cancer patients. (C) DNA methylation frequency (in %) of NEFH, NEFL, and NEFM were assessed in a cohort of 14 normal breast tissues from non-cancer patients and in a cohort of 185 primary breast cancers (BC) of stages 0 (DCIS) to 4. DNA methylation frequencies are plotted by tumor stage and are shown as an overall result. (D) Bisulfite sequencing of the NEFH region from −20 bp to +320, the NEFL region from −10 bp to +290 bp and the NEFM region from −140 bp to +240 bp relative to the TSS. Five sequencing reactions are shown for each sample representing clonal plasmids. White and black circles represent unmethylated and methylated CpG dinucleotides, respectively. NB presented the lowest methylation frequency ranging from 3.6% to 16.5% among the 3 genes on bisulfite sequencing. MCF-7 showed a high methylation frequency with almost every CpG methylated for the 3 genes while HMECs showed low methylation frequencies ranging from 11% to 25%. Breast primary tumor sample BC73 showed a methylation frequency ranging from 48% to 60% among the 3 genes.

Table 1. Statistical association between clinicopathological characteristics and methylation frequencies (%) of genes

Figure 3. Validating methylation of NEFH, NEFL, and NEFM and its inverse correlation with gene expression in breast tissues from The Cancer Genome Atlas (TCGA). (A) Methylation levels (β values) of representative probes from the Infinium HumanMethylation450 platform located within the NEFH, NEFL and NEFM promoter show a significant difference between normal breast tissues (n = 96 ) and primary breast tumors (n = 641 ). (B) Scatter plots depicting the correlation between the gene expression (y-axis; log2 values; analyzed on IlluminaHiSeq_RNA-SeqV2 platform) and DNA methylation (x-axis; β values; analyzed on Infinium HumanMethylation450 platform) of NEFH, NEFL and NEFM in 641 primary breast cancers from the TCGA data portal. Spearman rank correlation coefficients (rho) are displayed. A P value < 0.05 was considered statistically significant.
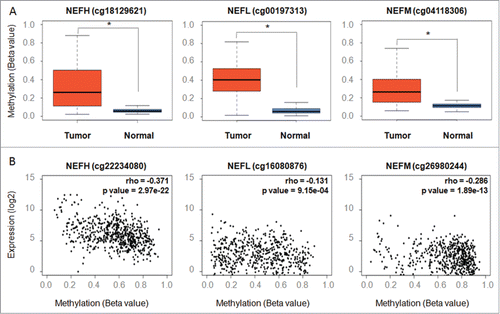
Figure 3. Validating methylation of NEFH, NEFL, and NEFM and its inverse correlation with gene expression in breast tissues from The Cancer Genome Atlas (TCGA). (A) Methylation levels (β values) of representative probes from the Infinium HumanMethylation450 platform located within the NEFH, NEFL and NEFM promoter show a significant difference between normal breast tissues (n = 96 ) and primary breast tumors (n = 641 ). (B) Scatter plots depicting the correlation between the gene expression (y-axis; log2 values; analyzed on IlluminaHiSeq_RNA-SeqV2 platform) and DNA methylation (x-axis; β values; analyzed on Infinium HumanMethylation450 platform) of NEFH, NEFL and NEFM in 641 primary breast cancers from the TCGA data portal. Spearman rank correlation coefficients (rho) are displayed. A P value < 0.05 was considered statistically significant.

Figure 4. Restoration of NEFH function suppresses tumor cell proliferation and growth by arresting MDA-MB-231 cells in Go/G1 phase. (A) MDA-MB-231 cells were transiently transfected with pcDNA3.1 (empty vector) or pcDNA3.1-NEFH and re-expression of NEFH was confirmed 96 hours post transfection by Western blot using α-NEFH antibody and α-GAPDH as a control. (B) Tumor cell clonogenicity was assessed on plastic and in soft-agar. Cells were transiently transfected with pcDNA3.1 (empty vector) or pcDNA3.1-NEFH and replated 24 hours post transfection for selection with Geneticin/G418. After 14 d of selection, colonies were stained with Giemsa and counted. MDA-MB-231 Mock cells (not transfected but treated with Lipofectamine 2000) were used as control for Geneticin selection. After 14 d of selection all MDA-MB-231 Mock cells were dead. Data presented are the mean of 2 independent experiments ± SEM. Group comparisons were carried out using Student t test, P**< 0.01 and P*< 0.05. (C) Proliferation rates of MDA-MB-231 cells 48, 72, and 96 hours post transfection with pcDNA3.1 (empty vector) and pcDNA3.1-NEFH and MDA-MB-231 mock transfected was measured by MTT assay. Data presented are the mean of 2 independent experiments ±SEM . Group comparisons were carried out using Student t test, P < 0.05. (D) Cell cycle distribution measured with Hoechst 33258 by flow cytometry of MDA-MB-231 cells 48 and 96 hours post transfection with pcDNA3.1 (empty vector) or pcDNA3.1-NEFH. MDA-MB-231 Mock cells (untransfected but treated with Lipofectamine 2000) were used as control of the experiment. Data represent 2 independent experiments. Group comparisons were carried out using Student t test, P < 0.01.
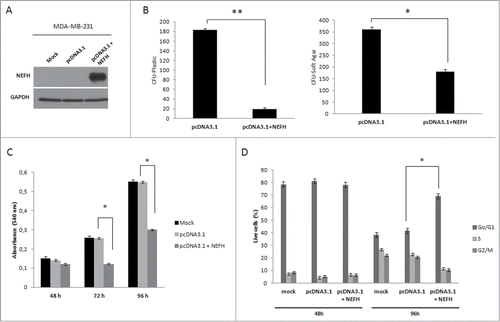
Figure 4. Restoration of NEFH function suppresses tumor cell proliferation and growth by arresting MDA-MB-231 cells in Go/G1 phase. (A) MDA-MB-231 cells were transiently transfected with pcDNA3.1 (empty vector) or pcDNA3.1-NEFH and re-expression of NEFH was confirmed 96 hours post transfection by Western blot using α-NEFH antibody and α-GAPDH as a control. (B) Tumor cell clonogenicity was assessed on plastic and in soft-agar. Cells were transiently transfected with pcDNA3.1 (empty vector) or pcDNA3.1-NEFH and replated 24 hours post transfection for selection with Geneticin/G418. After 14 d of selection, colonies were stained with Giemsa and counted. MDA-MB-231 Mock cells (not transfected but treated with Lipofectamine 2000) were used as control for Geneticin selection. After 14 d of selection all MDA-MB-231 Mock cells were dead. Data presented are the mean of 2 independent experiments ± SEM. Group comparisons were carried out using Student t test, P**< 0.01 and P*< 0.05. (C) Proliferation rates of MDA-MB-231 cells 48, 72, and 96 hours post transfection with pcDNA3.1 (empty vector) and pcDNA3.1-NEFH and MDA-MB-231 mock transfected was measured by MTT assay. Data presented are the mean of 2 independent experiments ±SEM . Group comparisons were carried out using Student t test, P < 0.05. (D) Cell cycle distribution measured with Hoechst 33258 by flow cytometry of MDA-MB-231 cells 48 and 96 hours post transfection with pcDNA3.1 (empty vector) or pcDNA3.1-NEFH. MDA-MB-231 Mock cells (untransfected but treated with Lipofectamine 2000) were used as control of the experiment. Data represent 2 independent experiments. Group comparisons were carried out using Student t test, P < 0.01.

Figure 5. Restoration of NEFH expression in MDA-MB-231 breast cancer cells slows tumor progression. (A) The cellular localization of NEFH protein in MDA-MB-231 cells transiently transfected with pcDNA3.1 and pcDNA3.1-NEFH was determined by immunofluorescence with anti-NEFH (FITC). Nuclei were visualized by staining with DAPI. The NEFH protein was not expressed in MDA-MB-231 cells transfected with pcDNA3.1 and just the nuclei was visualized in these cells. MDA-MB-231 wild type cells were also stained for NEFH to determine endogenous levels of NEFH expression and the specificity of the NEFH antibody and as NEFH protein was not expressed in MDA-MB-231 wild type cells just the nuclei was visualized in these cells. (B) Invasion and migration assays in MDA-MB-231 cells transfected with pcDNA3.1 (empty vector) or pcDNA3.1-NEFH. Twenty-four hours post transfection, cells were harvested, suspended in serum-free media and added either directly to the top chamber of transwell plates (migration assay) or to the top chamber of transwell plates that were layered with 2 mg/ml matrigel (invasion assay). Growth media containing 10% serum was added to the bottom chamber and cells were allowed to migrate or invade for 24 and 48 hours respectively. Cells attached to the membrane were fixed and subsequently stained with giemsa or crystal violet. For quantification of migrated or invaded cells X fields per well were randomly selected and counted. Data presented are the mean of 2 independent experiments § SEM. Group comparisons were carried out using Student t test, P < 0.05. (C) Representative images of the invasion assay in MDA-MB-231 cells transfected with either pcDNA3.1 (empty vector) or pcDNA3.1-NEFH. (D) Representative images of the migration assay in MDA-MB-231 cells transfected with pcDNA3.1 (empty vector) or pcDNA3.1-NEFH.
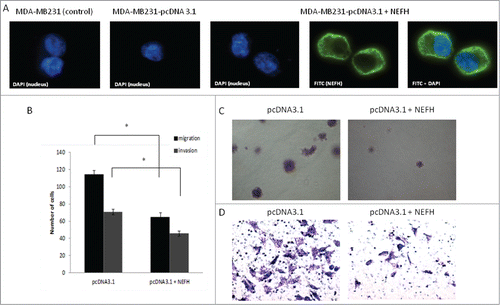
Figure 5. Restoration of NEFH expression in MDA-MB-231 breast cancer cells slows tumor progression. (A) The cellular localization of NEFH protein in MDA-MB-231 cells transiently transfected with pcDNA3.1 and pcDNA3.1-NEFH was determined by immunofluorescence with anti-NEFH (FITC). Nuclei were visualized by staining with DAPI. The NEFH protein was not expressed in MDA-MB-231 cells transfected with pcDNA3.1 and just the nuclei was visualized in these cells. MDA-MB-231 wild type cells were also stained for NEFH to determine endogenous levels of NEFH expression and the specificity of the NEFH antibody and as NEFH protein was not expressed in MDA-MB-231 wild type cells just the nuclei was visualized in these cells. (B) Invasion and migration assays in MDA-MB-231 cells transfected with pcDNA3.1 (empty vector) or pcDNA3.1-NEFH. Twenty-four hours post transfection, cells were harvested, suspended in serum-free media and added either directly to the top chamber of transwell plates (migration assay) or to the top chamber of transwell plates that were layered with 2 mg/ml matrigel (invasion assay). Growth media containing 10% serum was added to the bottom chamber and cells were allowed to migrate or invade for 24 and 48 hours respectively. Cells attached to the membrane were fixed and subsequently stained with giemsa or crystal violet. For quantification of migrated or invaded cells X fields per well were randomly selected and counted. Data presented are the mean of 2 independent experiments § SEM. Group comparisons were carried out using Student t test, P < 0.05. (C) Representative images of the invasion assay in MDA-MB-231 cells transfected with either pcDNA3.1 (empty vector) or pcDNA3.1-NEFH. (D) Representative images of the migration assay in MDA-MB-231 cells transfected with pcDNA3.1 (empty vector) or pcDNA3.1-NEFH.

Figure 6. Promoter methylation and mRNA expression of NEFH, NEFL and NEFM in various types of cancer. (A) Promoter methylation and mRNA expression of NEFH, NEFL and NEFM was assayed in 3 representative cell lines of each cancer type by MSP and RT-PCR, respectively. U and M marking unmethylated and methylated bands, respectively. Basal expression of NEFH, NEFL, and NEFM was confirmed in normal tissue of each cancer type. GAPDH expression was assayed as control. (B) Overall DNA methylation frequency (in %) of NEFH, NEFL, and NEFM in pancreas, gastric and colon cancer cell lines. (C) Overall DNA methylation frequency (in %) of NEFH, NEFL and NEFM in primary tissue of pancreas (n = 30), gastric (n = 30), and colon cancer (n = 128).
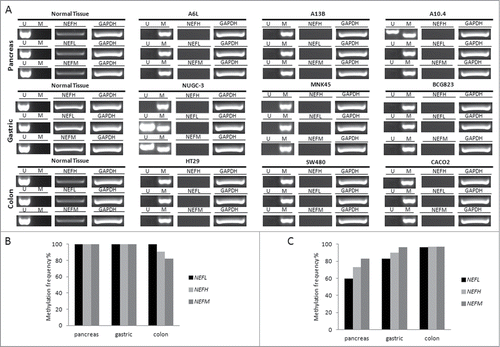
Figure 6. Promoter methylation and mRNA expression of NEFH, NEFL and NEFM in various types of cancer. (A) Promoter methylation and mRNA expression of NEFH, NEFL and NEFM was assayed in 3 representative cell lines of each cancer type by MSP and RT-PCR, respectively. U and M marking unmethylated and methylated bands, respectively. Basal expression of NEFH, NEFL, and NEFM was confirmed in normal tissue of each cancer type. GAPDH expression was assayed as control. (B) Overall DNA methylation frequency (in %) of NEFH, NEFL, and NEFM in pancreas, gastric and colon cancer cell lines. (C) Overall DNA methylation frequency (in %) of NEFH, NEFL and NEFM in primary tissue of pancreas (n = 30), gastric (n = 30), and colon cancer (n = 128).
Supplemental material

Supplemental_Material.zip

Download Zip (1.3 MB)

Reprints and Corporate Permissions

Please note: Selecting permissions does not provide access to the full text of the article, please see our help page How do I view content?

To request a reprint or corporate permissions for this article, please click on the relevant link below:

Academic Permissions

Please note: Selecting permissions does not provide access to the full text of the article, please see our help page How do I view content?

Obtain permissions instantly via Rightslink by clicking on the button below:

If you are unable to obtain permissions via Rightslink, please complete and submit this Permissions form. For more information, please visit our Permissions help page.