1,341
Views
14
CrossRef citations to date
0
Altmetric
Research Paper

Methylome sequencing for fibrolamellar hepatocellular carcinoma depicts distinctive features

, , , , , , , , , , , , , & show all
Pages 872-881 | Received 04 May 2015, Accepted 20 Jul 2015, Published online: 26 Aug 2015

Figures & data

Table 1. List of cases assessed by DREAM for DNA methylation

Figure 1. (A) Distribution of LINE-1 methylation levels in pure fibrolamellar carcinoma (p-FLC) and normal adjacent liver. Each dot represents the methylation level of individual samples. Horizontal lines represent the mean methylation levels for each group. (B) Kaplan-Meier curves for recurrence-free survival in low LINE-1 methylation group (n = 6) versus intermediate and high LINE-1 methylation group (n = 14). (C) Kaplan-Meier curves for overall survival in low LINE-1 methylation group (n = 6) vs. intermediate and high LINE-1 methylation group (n = 14).
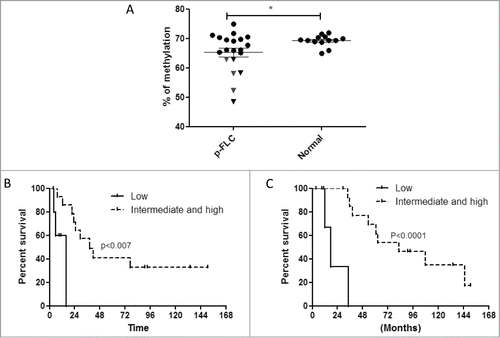
Figure 1. (A) Distribution of LINE-1 methylation levels in pure fibrolamellar carcinoma (p-FLC) and normal adjacent liver. Each dot represents the methylation level of individual samples. Horizontal lines represent the mean methylation levels for each group. (B) Kaplan-Meier curves for recurrence-free survival in low LINE-1 methylation group (n = 6) versus intermediate and high LINE-1 methylation group (n = 14). (C) Kaplan-Meier curves for overall survival in low LINE-1 methylation group (n = 6) vs. intermediate and high LINE-1 methylation group (n = 14).

Figure 2. (A) Correlation of DNA methylation % within CG sites detected by DREAM in 2 normal liver samples. Minimum coverage 10+ reads. Spearman r = 0.95, p < 0.0001. (B) Bar graphs of the number of genes gaining DNA methylation in each pure fibrolamellar carcinoma (p-FLC) and non-cirrhotic hepatocellular carcinoma (HCC) sample. (C) Bar graphs of the number of genes losing DNA methylation in each p-FLC and HCC sample. (D) Unsupervised clustering analysis using differentially methylated CG sites located in CG islands (CGI). (E) Unsupervised clustering analysis using differentially methylated CG sites located outside CGI.
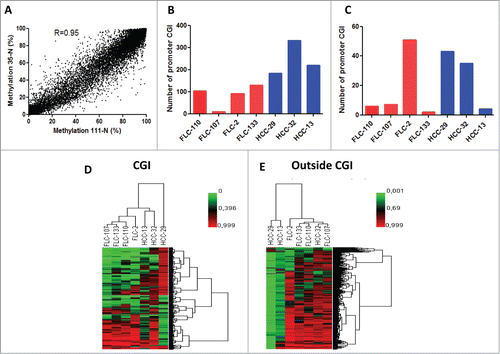
Figure 2. (A) Correlation of DNA methylation % within CG sites detected by DREAM in 2 normal liver samples. Minimum coverage 10+ reads. Spearman r = 0.95, p < 0.0001. (B) Bar graphs of the number of genes gaining DNA methylation in each pure fibrolamellar carcinoma (p-FLC) and non-cirrhotic hepatocellular carcinoma (HCC) sample. (C) Bar graphs of the number of genes losing DNA methylation in each p-FLC and HCC sample. (D) Unsupervised clustering analysis using differentially methylated CG sites located in CG islands (CGI). (E) Unsupervised clustering analysis using differentially methylated CG sites located outside CGI.

Figure 3. (A) Box-plots of percentage of CG sites covered by DREAM method and gaining DNA methylation, whether located in promoters or outside promoters according to their methylation levels in normal livers. Green is related to CG sites with methylation level < 20% in normal liver. Red is related to CG sites with methylation level ≥ 20% in normal liver. (B) Box-plots of percentage of CG sites covered by DREAM method and losing DNA methylation, whether located in promoters or outside promoters according to their methylation levels in normal livers. Green is related to CG sites with methylation level < 70% in normal liver. Red is related to CG sites with methylation level ≥ 70 % in normal liver. (C) Box-plots of percentage of CG sites gaining DNA methylation, according to different genomic regions. (D) Box-plots of percentage of CG sites losing DNA methylation, according to different genomic regions. Abbreviations: PMD: partially methylated domains; LAD: lamina associated domains. For statistical analysis: ns: non significant; *P-value < 0.05; **P-value < 0.001; ***P-value < 0.0001.
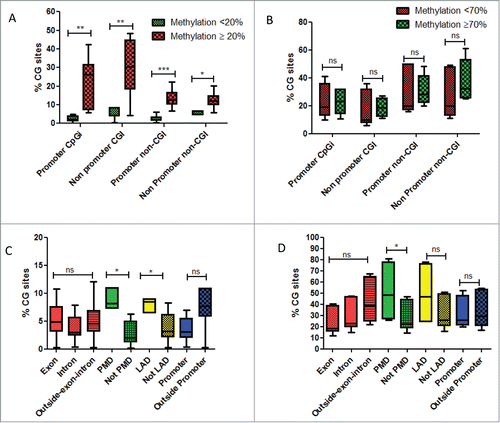
Figure 3. (A) Box-plots of percentage of CG sites covered by DREAM method and gaining DNA methylation, whether located in promoters or outside promoters according to their methylation levels in normal livers. Green is related to CG sites with methylation level < 20% in normal liver. Red is related to CG sites with methylation level ≥ 20% in normal liver. (B) Box-plots of percentage of CG sites covered by DREAM method and losing DNA methylation, whether located in promoters or outside promoters according to their methylation levels in normal livers. Green is related to CG sites with methylation level < 70% in normal liver. Red is related to CG sites with methylation level ≥ 70 % in normal liver. (C) Box-plots of percentage of CG sites gaining DNA methylation, according to different genomic regions. (D) Box-plots of percentage of CG sites losing DNA methylation, according to different genomic regions. Abbreviations: PMD: partially methylated domains; LAD: lamina associated domains. For statistical analysis: ns: non significant; *P-value < 0.05; **P-value < 0.001; ***P-value < 0.0001.

Figure 4. (A–B) Box-plots for expression levels of SMARCA4 and RXRA in pure fibrolamellar carcinoma and normal adjacent livers using our previously published microarray data related to 17 p-FLC and 10 normal livers cases. (C–D) Network of genes coordinated by SMARCA4 and RXRA according to Ingenuity Pathway Analysis. Red: upregulated; green: down-regulated.
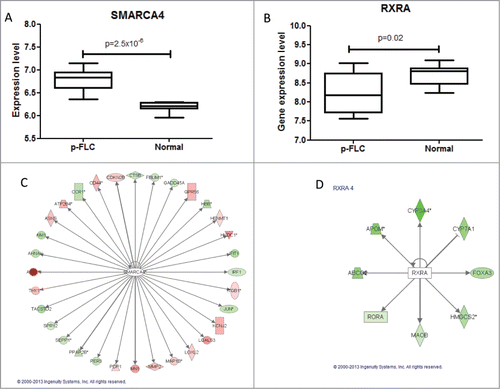
Figure 4. (A–B) Box-plots for expression levels of SMARCA4 and RXRA in pure fibrolamellar carcinoma and normal adjacent livers using our previously published microarray data related to 17 p-FLC and 10 normal livers cases. (C–D) Network of genes coordinated by SMARCA4 and RXRA according to Ingenuity Pathway Analysis. Red: upregulated; green: down-regulated.

Figure 5. Unsupervised clustering for DNA methylation using 4 sets of differentially methylated genes. Note that all but one pure fibrolamellar hepatocellular carcinoma (FLC) belong to cluster C1, while mixed fibrolamellar carcinoma and hepatocellular carcinoma in non-cirrhotic liver belong to cluster C2. For the only pure FLC which clustered within C2 cases, no RNA was available to check for the presence of fusion transcript.
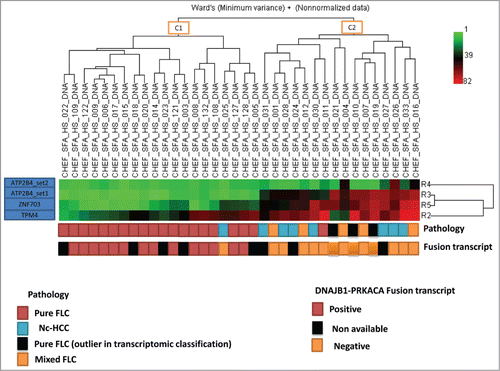
Figure 5. Unsupervised clustering for DNA methylation using 4 sets of differentially methylated genes. Note that all but one pure fibrolamellar hepatocellular carcinoma (FLC) belong to cluster C1, while mixed fibrolamellar carcinoma and hepatocellular carcinoma in non-cirrhotic liver belong to cluster C2. For the only pure FLC which clustered within C2 cases, no RNA was available to check for the presence of fusion transcript.

Figure 6. (A) Distribution of DLEU7 methylation levels in the validation set of pure fibrolamellar carcinoma (p-FLC), mixed FLC (m-FLC), non-cirrhotic hepatocellular carcinoma (nc-HCC) and normal adjacent liver. Each dot represents the methylation level of individual samples. Horizontal lines represent the mean methylation levels for each group. (B) Distribution of ZNF709 methylation levels in p-FLC, m-FLC, nc-HCC and normal adjacent liver. (C) Distribution of DUSP4 methylation levels in p-FLC, m-FLC, nc-HCC and normal adjacent liver. (D) Distribution of IGF2 methylation levels in p-FLC, m-FLC, nc-HCC and normal adjacent liver.
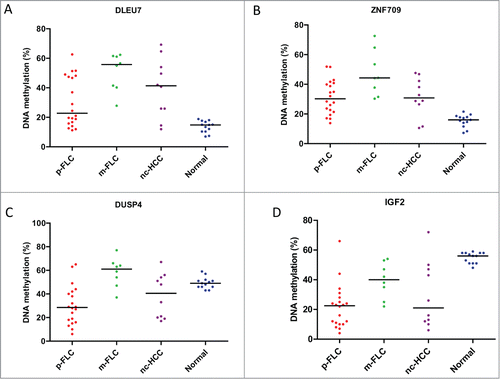
Figure 6. (A) Distribution of DLEU7 methylation levels in the validation set of pure fibrolamellar carcinoma (p-FLC), mixed FLC (m-FLC), non-cirrhotic hepatocellular carcinoma (nc-HCC) and normal adjacent liver. Each dot represents the methylation level of individual samples. Horizontal lines represent the mean methylation levels for each group. (B) Distribution of ZNF709 methylation levels in p-FLC, m-FLC, nc-HCC and normal adjacent liver. (C) Distribution of DUSP4 methylation levels in p-FLC, m-FLC, nc-HCC and normal adjacent liver. (D) Distribution of IGF2 methylation levels in p-FLC, m-FLC, nc-HCC and normal adjacent liver.
Supplemental material

1076955_Supplemental_Material.zip

Download Zip (7.4 MB)

Reprints and Corporate Permissions

Please note: Selecting permissions does not provide access to the full text of the article, please see our help page How do I view content?

To request a reprint or corporate permissions for this article, please click on the relevant link below:

Academic Permissions

Please note: Selecting permissions does not provide access to the full text of the article, please see our help page How do I view content?

Obtain permissions instantly via Rightslink by clicking on the button below:

If you are unable to obtain permissions via Rightslink, please complete and submit this Permissions form. For more information, please visit our Permissions help page.