1,317
Views
20
CrossRef citations to date
0
Altmetric
Research Paper

Stat3 is a candidate epigenetic biomarker of perinatal Bisphenol A exposure associated with murine hepatic tumors with implications for human health

, , &
Pages 1099-1110 | Received 14 Jul 2015, Accepted 07 Oct 2015, Published online: 01 Feb 2016

Figures & data

Table 1. Post-natal day 22 (PND22) mouse liver samples (n = 147) and 10-month mouse liver samples (n = 78) for bisulfite sequencing

Table 2. Candidate gene regions for bisulfite sequencing

Figure 1. Stat3 methylation in 10-month mouse livers by dose and tumor status. (A) Average percent DNA methylation at Stat3 by dose group in 10-month mice perinatally exposed to 50 ng (n = 20), 50 µg (n = 21) or 50 mg (n = 18) BPA/kg maternal diet or a phytoestrogen-free control diet (n = 19). (B) Percent DNA methylation at Stat3 by tumor status in 10-month mice perinatally exposed to 50 ng (n = 20), 50 µg (n = 21) or 50 mg (n = 18) BPA/kg maternal diet or a phytoestrogen-free control diet (n = 19). *P <0.1, **P<0.05
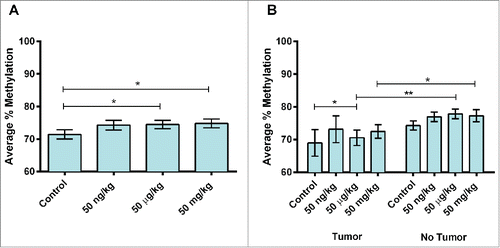
Figure 1. Stat3 methylation in 10-month mouse livers by dose and tumor status. (A) Average percent DNA methylation at Stat3 by dose group in 10-month mice perinatally exposed to 50 ng (n = 20), 50 µg (n = 21) or 50 mg (n = 18) BPA/kg maternal diet or a phytoestrogen-free control diet (n = 19). (B) Percent DNA methylation at Stat3 by tumor status in 10-month mice perinatally exposed to 50 ng (n = 20), 50 µg (n = 21) or 50 mg (n = 18) BPA/kg maternal diet or a phytoestrogen-free control diet (n = 19). *P <0.1, **P<0.05

Figure 2. Site-specific Stat3 methylation in 10-month mouse livers by dose. (A) Average percent DNA methylation at Stat3 by dose group in 10-month mice perinatally exposed to 50 ng (n = 20), 50 µg (n = 21) or 50 mg (n = 18) BPA/kg maternal diet or a phytoestrogen-free control diet (n = 19). is the same as . These data are repeated for ease of comparison by the reader. (B) Percent DNA methylation at Stat3 by CpG site in 10-month mice perinatally exposed to 50 ng (n = 20), 50 µg (n = 21) or 50 mg (n = 18) BPA/kg maternal diet or a phytoestrogen-free control diet (n = 19). *P < 0.1, **P < 0.05.
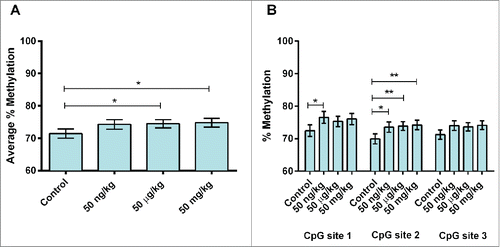
Figure 2. Site-specific Stat3 methylation in 10-month mouse livers by dose. (A) Average percent DNA methylation at Stat3 by dose group in 10-month mice perinatally exposed to 50 ng (n = 20), 50 µg (n = 21) or 50 mg (n = 18) BPA/kg maternal diet or a phytoestrogen-free control diet (n = 19). Figure 1A is the same as Figure 2A. These data are repeated for ease of comparison by the reader. (B) Percent DNA methylation at Stat3 by CpG site in 10-month mice perinatally exposed to 50 ng (n = 20), 50 µg (n = 21) or 50 mg (n = 18) BPA/kg maternal diet or a phytoestrogen-free control diet (n = 19). *P < 0.1, **P < 0.05.

Figure 3. Site-specific Stat3 methylation in PND22 mouse livers by dose. (A) Average percent DNA methylation at Stat3 by dose group in post-natal day 22 (PND22) mice perinatally exposed to 50 ng (n = 48), 50 µg (n = 22) or 50 mg (n = 40) BPA/kg maternal diet or a phytoestrogen-free control diet (n = 37). is the same as . These data are repeated for ease of comparison by the reader. (B) Percent DNA methylation at Stat3 by CpG site in PND22 mice perinatally exposed to 50 ng (n = 48), 50 µg (n = 22) or 50 mg (n = 40) BPA/kg maternal diet or a phytoestrogen-free control diet (n = 37). *P < 0.1, **P < 0.05.
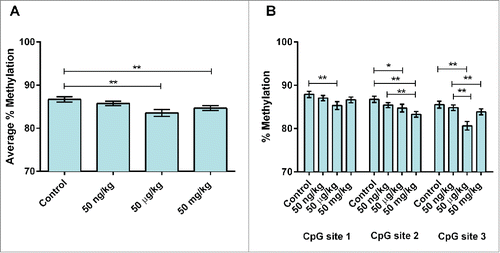
Figure 3. Site-specific Stat3 methylation in PND22 mouse livers by dose. (A) Average percent DNA methylation at Stat3 by dose group in post-natal day 22 (PND22) mice perinatally exposed to 50 ng (n = 48), 50 µg (n = 22) or 50 mg (n = 40) BPA/kg maternal diet or a phytoestrogen-free control diet (n = 37). Figure 2A is the same as Figure 1A. These data are repeated for ease of comparison by the reader. (B) Percent DNA methylation at Stat3 by CpG site in PND22 mice perinatally exposed to 50 ng (n = 48), 50 µg (n = 22) or 50 mg (n = 40) BPA/kg maternal diet or a phytoestrogen-free control diet (n = 37). *P < 0.1, **P < 0.05.

Figure 4. STAT3 methylation in human fetal livers by continuous total BPA. Average percent DNA methylation at STAT3 by dose group in human fetal liver samples (n = 50) by continuous liver tissue total BPA.
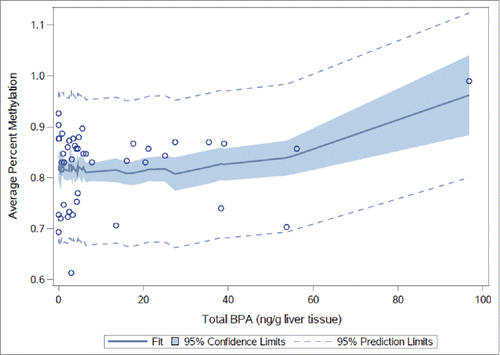
Figure 4. STAT3 methylation in human fetal livers by continuous total BPA. Average percent DNA methylation at STAT3 by dose group in human fetal liver samples (n = 50) by continuous liver tissue total BPA.

Figure 5. STAT3 methylation in human fetal livers by continuous free BPA. Average percent DNA methylation at STAT3 by dose group in human fetal liver samples (n = 50) by continuous liver tissue free BPA.
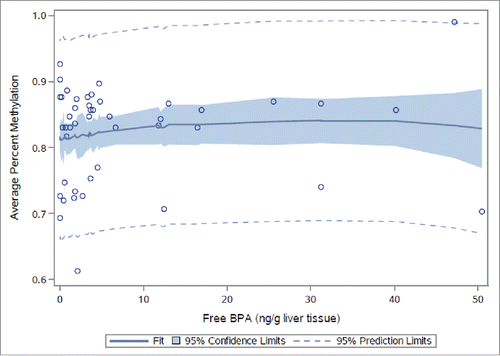
Figure 5. STAT3 methylation in human fetal livers by continuous free BPA. Average percent DNA methylation at STAT3 by dose group in human fetal liver samples (n = 50) by continuous liver tissue free BPA.

Table 3. Primer sets for bisulfite sequencing.

Table 4. Primer sets for mRNA expression analysis for Stat3, STAT3, and reference genes via qPCR.

Supplemental material

KEPI_A_1107694_Supplemental.pdf

Download PDF (695.1 KB)

Reprints and Corporate Permissions

Please note: Selecting permissions does not provide access to the full text of the article, please see our help page How do I view content?

To request a reprint or corporate permissions for this article, please click on the relevant link below:

Academic Permissions

Please note: Selecting permissions does not provide access to the full text of the article, please see our help page How do I view content?

Obtain permissions instantly via Rightslink by clicking on the button below:

If you are unable to obtain permissions via Rightslink, please complete and submit this Permissions form. For more information, please visit our Permissions help page.