1,003
Views
6
CrossRef citations to date
0
Altmetric
Research Paper

Epigenetic instability at imprinting control regions in a KrasG12D-induced T-cell neoplasm

, , &
Pages 1111-1120 | Received 27 Jul 2015, Accepted 15 Oct 2015, Published online: 01 Feb 2016

Figures & data

Figure 1. Targeting oncogenic KrasG12D expression and PEG3 deletion to the mouse thymus. (A) Upon Cre-mediated recombination: the allele housing the KrasG12D mutation (denoted by *12D) is conditionally expressed by removal of a tandem polyA signal. The critical exon 6 (denoted by yellow coloration) of Peg3 is conditionally deleted. Blue font denotes the allele is paternally inherited and pink font denotes the allele is maternally inherited. Gray boxes denote exons. Black triangles denote loxP sites. Filled in lollipops denote a methylated CpG island. Empty lollipops denote an unmethylated CpG island. (B) Breeding schematic from mating LSL-Kras+/G12D; Peg3+/del6 mice with MMTV-Cre mice to generate KPM, KM, PM, and M cohorts. (C) Specific PCR analysis of genomic DNA isolated from thymus confirms recombinant products for each of the targeted alleles.
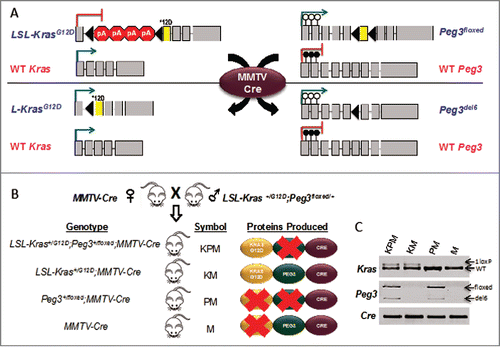
Figure 1. Targeting oncogenic KrasG12D expression and PEG3 deletion to the mouse thymus. (A) Upon Cre-mediated recombination: the allele housing the KrasG12D mutation (denoted by *12D) is conditionally expressed by removal of a tandem polyA signal. The critical exon 6 (denoted by yellow coloration) of Peg3 is conditionally deleted. Blue font denotes the allele is paternally inherited and pink font denotes the allele is maternally inherited. Gray boxes denote exons. Black triangles denote loxP sites. Filled in lollipops denote a methylated CpG island. Empty lollipops denote an unmethylated CpG island. (B) Breeding schematic from mating LSL-Kras+/G12D; Peg3+/del6 mice with MMTV-Cre mice to generate KPM, KM, PM, and M cohorts. (C) Specific PCR analysis of genomic DNA isolated from thymus confirms recombinant products for each of the targeted alleles.

Figure 2. Gross features of mice expressing the KrasG12D mutation. (A) Kaplan-Meier comparative survival analysis of KM, KPM, PM, and M cohorts. Median survival of KPM and KM mice was significantly less than PM and M cohorts (P< 0.001, log-rank test, for each pairwise combination). (B) Organ weight profiles of KPM, KM, PM, and M cohorts. Spleen and liver percent of body weight was significantly increased in KPM and KM cohorts (P < 0.001, pairwise t-test). (C) Images of hepatomegaly, enlarged thymus, and splenomegaly.
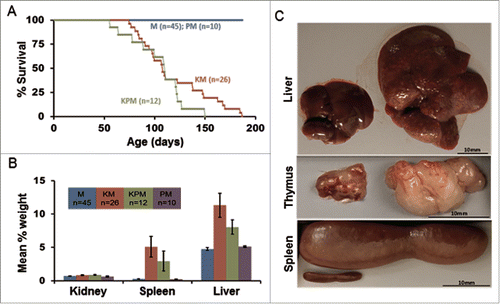
Figure 2. Gross features of mice expressing the KrasG12D mutation. (A) Kaplan-Meier comparative survival analysis of KM, KPM, PM, and M cohorts. Median survival of KPM and KM mice was significantly less than PM and M cohorts (P< 0.001, log-rank test, for each pairwise combination). (B) Organ weight profiles of KPM, KM, PM, and M cohorts. Spleen and liver percent of body weight was significantly increased in KPM and KM cohorts (P < 0.001, pairwise t-test). (C) Images of hepatomegaly, enlarged thymus, and splenomegaly.

Figure 3. Histological thymic alterations in KM mice. (A) The cortex is expanded by a heterogeneous (hyperplastic) lymphoid cell population, with retention of the normal thymic architecture in a 1-month-old KM mouse. (B) The architecture of the hyperplastic thymus in a 1-month-old KM mouse is maintained, with the majority of CD3 immunopositive cells in the cortex. (C) The normal architecture of the thymus is completely effaced by a lymphoid round cell neoplasm in a 2.5-month-old KM mouse. (D) Neoplastic lymphoid cells effacing the thymus in a 2.5-month-old KM mouse are diffusely CD3 immunopositive, consistent with T-cell origin of the neoplasm. (E-G) H&E staining of nearby tissues. (E) Neoplastic cells invade adjacent adipose tissue. (F) Neoplastic cells encircling ganglia. (H) Neoplastic cells invade the myocardium at the base of the heart (G) Neoplastic cells invade the musculature of the sternum. All insets show to neoplastic cells at 400X.
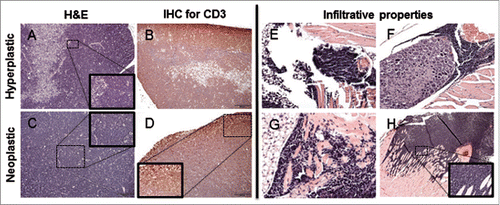
Figure 3. Histological thymic alterations in KM mice. (A) The cortex is expanded by a heterogeneous (hyperplastic) lymphoid cell population, with retention of the normal thymic architecture in a 1-month-old KM mouse. (B) The architecture of the hyperplastic thymus in a 1-month-old KM mouse is maintained, with the majority of CD3 immunopositive cells in the cortex. (C) The normal architecture of the thymus is completely effaced by a lymphoid round cell neoplasm in a 2.5-month-old KM mouse. (D) Neoplastic lymphoid cells effacing the thymus in a 2.5-month-old KM mouse are diffusely CD3 immunopositive, consistent with T-cell origin of the neoplasm. (E-G) H&E staining of nearby tissues. (E) Neoplastic cells invade adjacent adipose tissue. (F) Neoplastic cells encircling ganglia. (H) Neoplastic cells invade the myocardium at the base of the heart (G) Neoplastic cells invade the musculature of the sternum. All insets show to neoplastic cells at 400X.

Figure 4. Signature of aberrant DNA methylation in KrasG12D-induced lymphoblastic thymic T-cell lymphoma. Heat map summary of the quantified COBRA data for all ICRs tested in 15 thymic samples. Based on P values from pairwise T-test, each locus tested in the thymic samples was determined to be hypermethylated (red), hypomethylated (green), or not changed (gray). The gradation of yellow in the sample # column depicts progression of the disease state from hyperplastic (white) to atypically hyperplastic to neoplastic (yellow).
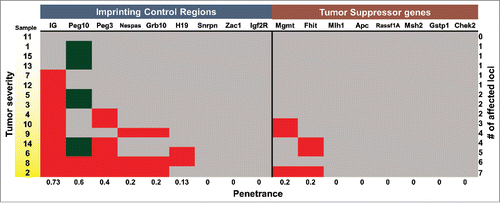
Figure 4. Signature of aberrant DNA methylation in KrasG12D-induced lymphoblastic thymic T-cell lymphoma. Heat map summary of the quantified COBRA data for all ICRs tested in 15 thymic samples. Based on P values from pairwise T-test, each locus tested in the thymic samples was determined to be hypermethylated (red), hypomethylated (green), or not changed (gray). The gradation of yellow in the sample # column depicts progression of the disease state from hyperplastic (white) to atypically hyperplastic to neoplastic (yellow).

Figure 5. Distal enhancer regions may prove to be effective biomarkers. A-B: Aberrant DNA methylation comparison of the Peg3-ICR and the Peg3-ECR18. A: COBRA of the Peg3-ICR. B: COBRA of the Peg3-ECR18. Unmethylated DNA is denoted with a U. Methylated DNA is denoted with a M. Stars represent significant increases in DNA methylation compared to normal DNA (denoted by the letter N). Experimental samples are numbered 1–15. Red represents hypermethylation, gray represents no change, and blue represents normal/control levels.
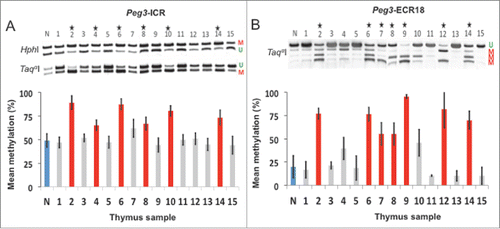
Figure 5. Distal enhancer regions may prove to be effective biomarkers. A-B: Aberrant DNA methylation comparison of the Peg3-ICR and the Peg3-ECR18. A: COBRA of the Peg3-ICR. B: COBRA of the Peg3-ECR18. Unmethylated DNA is denoted with a U. Methylated DNA is denoted with a M. Stars represent significant increases in DNA methylation compared to normal DNA (denoted by the letter N). Experimental samples are numbered 1–15. Red represents hypermethylation, gray represents no change, and blue represents normal/control levels.

Figure 6. Aberrant DNA methylation is targeted to ICRs within imprinted domains. Images generated from COBRA analysis of 3 regulatory regions within the Gnas and Dlk1/Gtl2 domains. For each domain, the ICR, a nearby DMR and a nearby promoter were measured. Unmethylated DNA is denoted with a U, while methylated DNA is denoted with an M. The enzymes used to digest each amplicon are presented under the name of each PCR product.
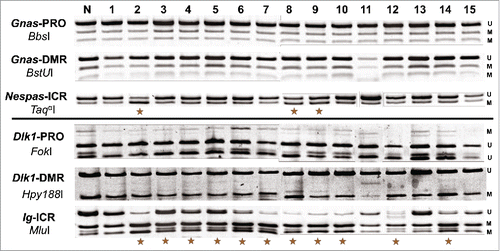
Figure 6. Aberrant DNA methylation is targeted to ICRs within imprinted domains. Images generated from COBRA analysis of 3 regulatory regions within the Gnas and Dlk1/Gtl2 domains. For each domain, the ICR, a nearby DMR and a nearby promoter were measured. Unmethylated DNA is denoted with a U, while methylated DNA is denoted with an M. The enzymes used to digest each amplicon are presented under the name of each PCR product.

Figure 7. Bisulfite NGS reveals not all CpG are equally vulnerable to DNA methylation changes. Heat maps generated by BiQ analyzer HT showing DNA methylation at each CpG (Nos. One–16) within bisulfite PCR products. Results from the Peg3-ICR are shown as a representative set. Each column represents a CpG within the bisulfite PCR product and each row represents a sequencing read. The positions of the restriction sites utilized in COBRA are indicated below the heat map of the control sample (N) with triangles (black for TaqαI and purple for HphI). Mean methylation (%) and number of reads are presented above each map. Below the heat maps is a UCSC genome browser view of putative CSEl containing CpGs # 4–7. Sequences are highlighted based on matching the consensus motif of the SP1 transcription factor. An expansion of CSE1 is proposed based on the most hypermethylation resistant CpG, # 3, being contained in a highly conserved region that matched very well with the SP1 binding motif and was not included in putative CSE1.
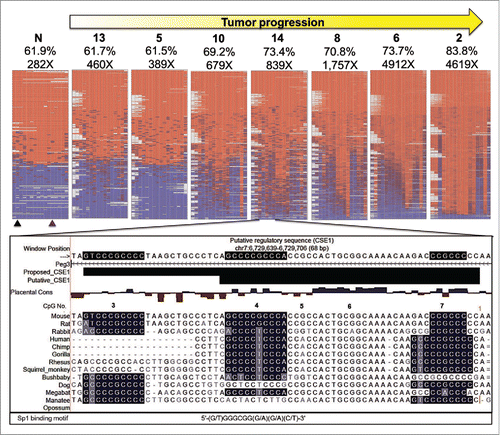
Figure 7. Bisulfite NGS reveals not all CpG are equally vulnerable to DNA methylation changes. Heat maps generated by BiQ analyzer HT showing DNA methylation at each CpG (Nos. One–16) within bisulfite PCR products. Results from the Peg3-ICR are shown as a representative set. Each column represents a CpG within the bisulfite PCR product and each row represents a sequencing read. The positions of the restriction sites utilized in COBRA are indicated below the heat map of the control sample (N) with triangles (black for TaqαI and purple for HphI). Mean methylation (%) and number of reads are presented above each map. Below the heat maps is a UCSC genome browser view of putative CSEl containing CpGs # 4–7. Sequences are highlighted based on matching the consensus motif of the SP1 transcription factor. An expansion of CSE1 is proposed based on the most hypermethylation resistant CpG, # 3, being contained in a highly conserved region that matched very well with the SP1 binding motif and was not included in putative CSE1.
Supplemental material

Supplemental.zip

Download Zip (17.5 MB)

Reprints and Corporate Permissions

Please note: Selecting permissions does not provide access to the full text of the article, please see our help page How do I view content?

To request a reprint or corporate permissions for this article, please click on the relevant link below:

Academic Permissions

Please note: Selecting permissions does not provide access to the full text of the article, please see our help page How do I view content?

Obtain permissions instantly via Rightslink by clicking on the button below:

If you are unable to obtain permissions via Rightslink, please complete and submit this Permissions form. For more information, please visit our Permissions help page.