Figures & data
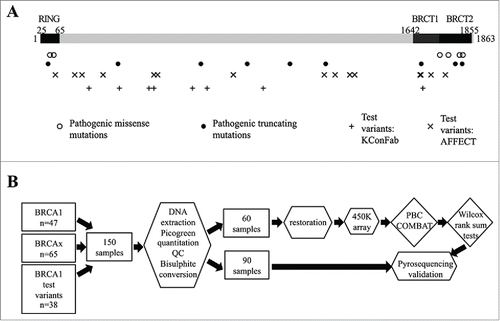
Figure 1. Study Design. (A) Representation of the exonic position of the known mutations in the BRCA1 gene used in this study, including pathogenic (missense and truncating) and test variants. Some variants are represented by multiple tumors. (B) Flow diagram illustrating study design. Rectangular boxes indicate samples, hexagonal boxes represent experimental processes, and diamond-shaped boxes denote bioinformatics processes or analysis.

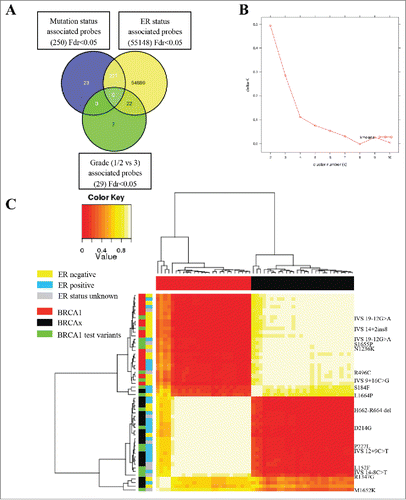
Figure 2. Methylation array (450K) analysis defines pathogenic and neutral variants. (A) Venn diagram representing the comparison of significant probe lists (FDR <0.05), showing 23 probes only significant in the mutation status analysis. (B) Consensus clustering using 18 probes with a difference in methylation between BRCA1 mutated and BRCAx greater than 5% identified two main clusters, as shown by kmeans plot. (C) The resulting correlation matrix from these two clusters shows that these clusters correlate with mutation status. Unclassified variants in green clustered with either the BRCA1 tumors or the BRCAx tumors.

Table 1. Candidate gene validation by pyrosequencing.
Figure 3. Validation of LYRM9, BACH2, LOC654342, and C8orf31 loci. (A) Strip charts show array β values for the four validated loci plotted by mutation status. Blue dotted line is plotted at the median of BRCA1 and BRCAx samples. ER negative samples are colored red, ER positive samples are colored blue, and those samples for which ER status is unknown are colored green [BRCA1 (n=18), BRCAx (n=19), BRCA1 test variant (n=17), except BACH2, where BRCA1 n=17]. (B) Strip charts showing the pyrosequencing methylation value of the independent group of samples validating the difference observed on the array [LYRM9:BRCA1 (n=19), BRCAx (n=29), test variant (UV) (n=11); BACH2:BRCA1 (n=19), BRCAx (n=27), test variant (UV) (n=18); C8orf31: BRCA1 (n=16), BRCAx (n=11), test variant (UV)(n=20). LOC654342:BRCA1 (n=9), BRCAx (n=18), test variant (UV) (n=7)].
![Figure 3. Validation of LYRM9, BACH2, LOC654342, and C8orf31 loci. (A) Strip charts show array β values for the four validated loci plotted by mutation status. Blue dotted line is plotted at the median of BRCA1 and BRCAx samples. ER negative samples are colored red, ER positive samples are colored blue, and those samples for which ER status is unknown are colored green [BRCA1 (n=18), BRCAx (n=19), BRCA1 test variant (n=17), except BACH2, where BRCA1 n=17]. (B) Strip charts showing the pyrosequencing methylation value of the independent group of samples validating the difference observed on the array [LYRM9:BRCA1 (n=19), BRCAx (n=29), test variant (UV) (n=11); BACH2:BRCA1 (n=19), BRCAx (n=27), test variant (UV) (n=18); C8orf31: BRCA1 (n=16), BRCAx (n=11), test variant (UV)(n=20). LOC654342:BRCA1 (n=9), BRCAx (n=18), test variant (UV) (n=7)].](/cms/asset/faf43370-5d63-41b9-a2dd-adf438ca7206/kepi_a_1111504_f0003_oc.gif)
Table 2. Logistic regression analysis of candidate genes.
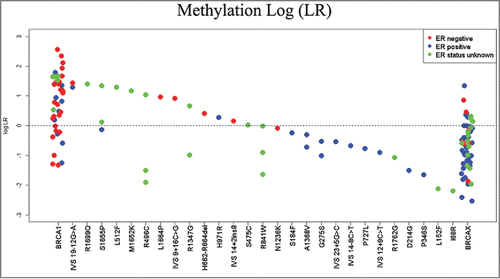
Figure 4. Combined methylation likelihood ratios. LRs were calculated for each sample using the model including only methylation. The log of the combined LR is plotted here corresponding to each variant assayed.

Table 3. Combined summary predictions of all unknown variants analyzed.
