
Figures & data
Figure 1. Prenatal immune activation produces working memory and social interaction deficits. (A) Working memory was assessed in the Y-maze spatial recognition paradigm. Left: The bar plot depicts the percent time spent in the novel (previously unexplored) arm during the choice phase of the test in control (CON) and poly(I:C) (POL) offspring. *P < 0.05 as determined by a Student t-test. Right: The bars plot shows the total distance moved during the choice phase of the test. (B) Social interaction was assessed by analyzing the relative exploration time between an unfamiliar congenic mouse (‘mouse’) and an inanimate dummy object (‘dummy’). The bar plots show the relative exploration time between the mouse and the dummy for the CON and POL offspring. *P < 0.05 as determined by a Student t-test. N(CON) = 8, N(POL) = 8. All values are means ± SEM.
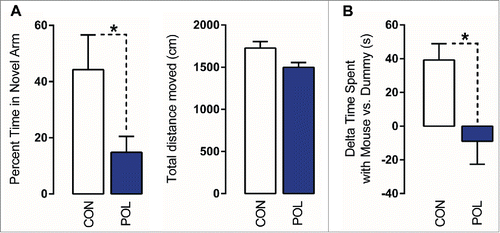
Table 1. Correlation analyses between behavioral performance and epigenetic markers at the GAD1 (Regions 1 and 2) and GAD2 promoter regions in the medial prefrontal cortex (mPFC) of control (CON) and poly(I:C) (POL) offspring. Behavioral performance variables included in the analysis were the percent time spent in the novel arm in the Y-maze test and the delta time spent with mouse vs. dummy in the social interaction test. Epigenetic markers included in the analysis were 5-methylcytosine (5mC) binding, 5-hydroxymethylcytosine (5hmC) binding, and methyl CpG-binding protein 2 (MeCP2) binding at the GAD1 (regions 1 and 2) and GAD2 promoter regions. The correlations were performed using Pearson's product moment correlations. The coefficients of correlation r are given in the table for each correlative comparison.
Figure 2. Sequences and genomic locations of the GAD1 and GAD2 promoter regions of interest. Two assays (before and after the transcriptional start site, TSS) were performed on the GAD1 promoter based on previous studies looking at sequences within both these regions,Citation43,45 while one assay (before the TSS) was performed on the GAD2 gene.
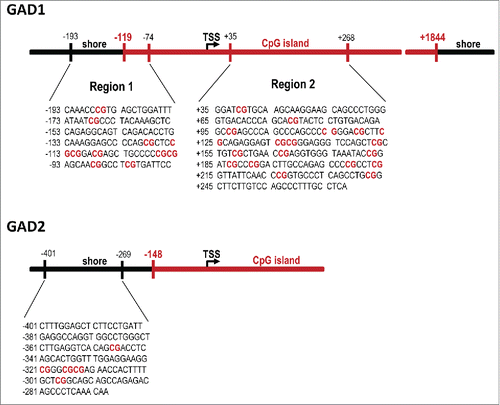
Figure 3. Prenatal immune activation increases 5-methylcytosine (5mC) and 5-hydroxymethylcytosine (5hmC) binding at the GAD1 promoter region in the medial prefrontal cortex (mPFC) (A) 5mC binding was assessed by comparing the ratio of 5mC to the total cytosines in genomic DNA samples of control (CON) and poly(I:C) (POL) offspring. Left: The line plot shows 5mC ratios at both promoter regions of interest (Region 1, R1; Region 2, R2) for the CON and POL offspring. Right: The bar plot shows the mean 5mC ratios for both regions R1 and R2. *P < 0.05 as determined by a main effect of treatment arising in the repeated-measures ANOVA analysis over the two regions R1 and R2 of interest. (B) 5hmC binding was assessed by comparing the ratio of 5hmC to the total cytosines in genomic DNA samples of CON and POL offspring. Left: The line plot shows 5hmC ratios at both promoter regions of interest R1 and R2. Right: The bar plot shows the mean 5hmC ratios for R1 and R2. *P < 0.05 as determined by a main effect of treatment arising in the repeated-measures ANOVA analysis over the two regions R1 and R2 of interest. N(CON) = 8, N(POL) = 8. All values are means ± SEM.
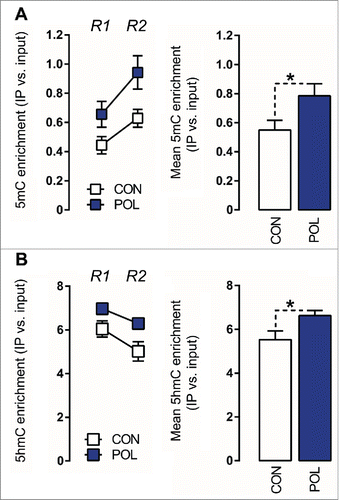
Figure 4. Prenatal immune activation increases 5-methylcytosine (5mC) binding at the GAD2 promoter region in the medial prefrontal cortex (mPFC). (A) 5mC binding was assessed by comparing the ratio of 5mC to the total cytosines in genomic DNA samples of control (CON) and poly(I:C) (POL) offspring. The bar plot shows 5mC ratios within the region of interest. *P < 0.05 as determined by a Student t-test. (B) 5hmC binding was assessed by comparing the ratio of 5hmC to the total cytosines in genomic DNA samples of CON and POL offspring. The bar plot shows 5hmC ratios within the region of interest. N(CON) = 8, N(POL) = 8. All values are means ± SEM.
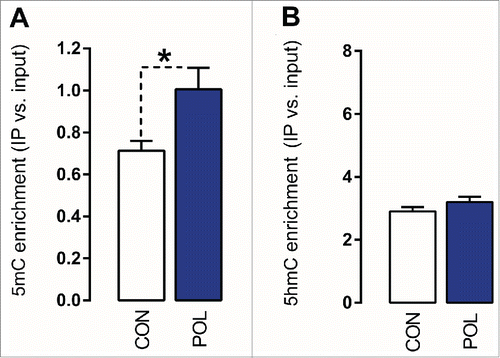
Figure 5. Prenatal immune activation increases methyl CpG-binding protein 2 (MeCP2) binding at the GAD1 and GAD2 promoter regions in the medial prefrontal cortex (mPFC) (A) MeCP2 binding at the GAD1 promoter. Left: the line plot shows MeCP2 binding at both promoter regions of interest (Region 1, R1; Region 2, R2) for the control (CON) and poly(I:C) (POL) offspring. Right: the bar plot shows the mean MeCP2 for both regions R1 and R2. *P < 0.05 as determined by a main effect of treatment arising in the repeated-measures ANOVA analysis. (B) MeCP2 binding at the GAD2 promoter. The bar plot shows the MeCP2 binding values in the region of interest in CON and POL offspring. **P < 0.01 as determined by a Student t-test. N(CON) = 7, N(POL) = 7. All values are means ± SEM.
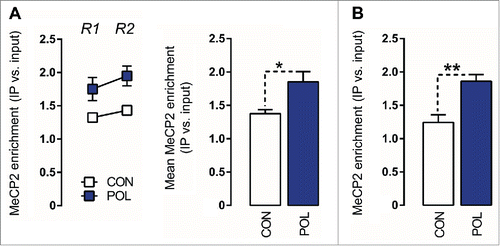
Figure 6. Significant correlations between behavioral performance and epigenetic markers at the GAD1 pre-TSS (transcriptional start site) promoter region in the medial prefrontal cortex (mPFC) of control (CON) and poly(I:C) (POL) offspring. Behavioral performance variables included in the analysis were the percent time spent in the novel arm in the Y-maze test and the delta time spent with mouse vs. dummy in the social interaction test. Epigenetic markers included in the analysis were 5-methylcytosine (5mC) binding or 5-hydroxymethylcytosine (5hmC) binding at the GAD1 pre-TSS promoter region. The correlations were performed using Pearson's product moment correlations. The regression lines represent the correlative analyses, r is the slope of the regression lines and P is the P-value. N = 16 (8 CON, 8 POL) for each correlation.
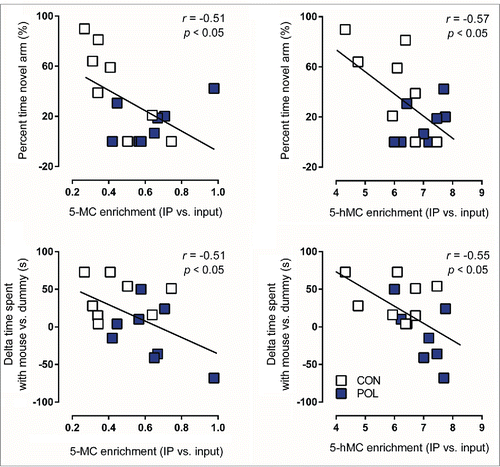
Figure 7. Prenatal immune activation reduces the mRNA levels of GAD67 and GAD65 in the medial prefrontal cortex (mPFC). The graphs depict the levels of normalized mRNA expression of GAD67 and GAD65 in control (CON) and poly(I:C)-exposed (POL) offspring. N(CON) = 10 and N(POL) = 7. *P< 0.05 and **P < 0.01. All values are means ± SEM.
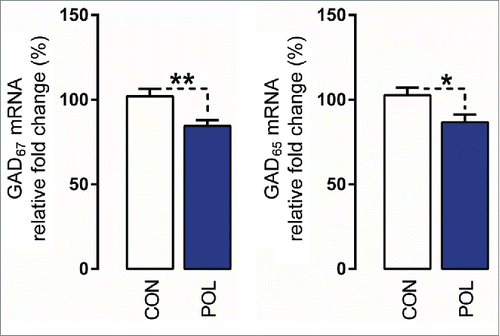
Table 2. Primers used in the methylation assays and real-time PCR analyses. Top: Primers for the epigenetic assays. The three columns give the sequences of the forward and reverse primers, as well as the genomic location of the amplicon (*) as compared to the transcriptional start site (TSS) defined using the UCSC Genome Browser, positions chr2:70562163 (TGTAGTTTAA…) for GAD1 and chr2:22,622,326 (CTCCCTAAAA…) for GAD2. Bottom: Primers for the real-time PCR analyses given the forward and reverse primers for GAD1, GAD,2 and β-Actin assays.