Figures & data
Figure 1. Coefficient of linkage disequilibrium D indicates the linkage between 2 adjacent CpG sites. (A) The methylation level and the range of D. The D has a maximum range at the intermediate methylation level. The sign of D corresponds to the concordant (red bars) or discordant (blue bars) linkage. (B) An example plot of methylation level and D in mouse embryonic stem cells at the genomic region chr1:134,200,000–134,600,000. Upper track: methylation levels of individual CpG sites (black). Lower track: D values of individual CpG pairs (red for positive and blue for negative values). Bottom track shows the gene annotation.
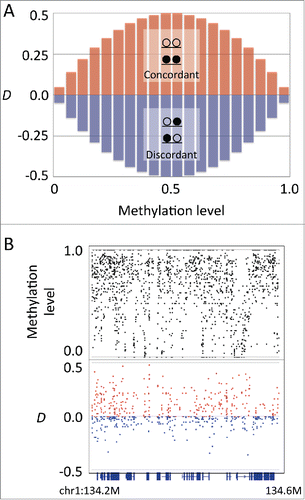
Figure 2. Germline cells showed positive D values. (A) Boxplots of D at various methylation levels in male primordial germ cells at embryonic day 10.5. (B) Boxplot for D at intermediate methylation level (0.25–0.75) in various cell types (female and male primordial germ cells at embryonic days 10.5, 13.5, and 16.5, non-growing oocytes, germinal vesicle oocytes, sperm cells, embryonic stem cells, and astrocytes).
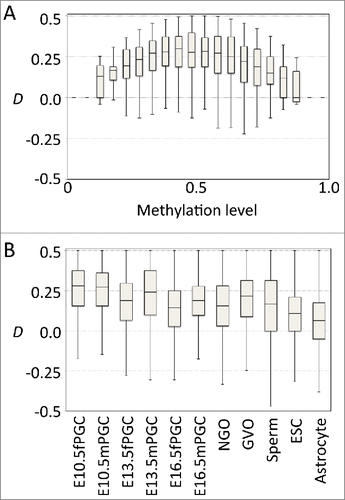
Figure 3. D in known imprinting loci. (A) Schematic representation of allele constitutions at paternally imprinted loci for sperms, oocytes, and zygotes. Alleles in sperms and in oocytes are fully unmethylated and methylated, respectively. Alleles in zygotes are a mixture of unmethylated and methylated. (B) Plots of methylation levels (black) and D (red for positive and blue for negative values) at paternally imprinted loci (Peg10 and Kcnq1ot1) in sperms, oocytes, male and female primordial germ cells (embryonic day 10.5), embryonic stem cells, and astrocytes. While D is close to zero in sperms and oocytes, D becomes positive in primordial germ cells, embryonic stem cells, and astrocytes at imprinting loci. Located at the bottom is the track for gene annotation.
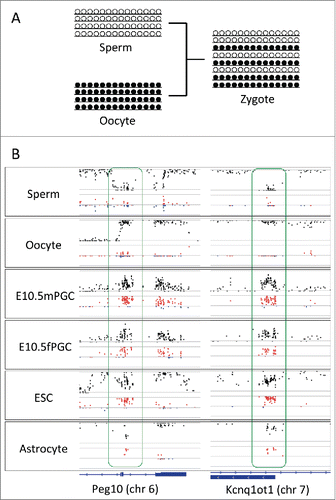
Figure 4. D in the transitional zone. (A) Two models explaining allelic heterogeneity in the transitional zone, i.e., boundary position is stochastic (upper panel) or methylation activity is stochastic (lower panel) at the transitional zone. (B) Plots showing the methylation level (upper panel, black) and D (lower panel, red for positive and blue for negative values) at the transitional zone (chr1:156,200,000–156,300,000), where methylation levels showed fluctuation around 0.5 and D showed conspicuous deviation to positive values. Bottom track shows the gene annotation.
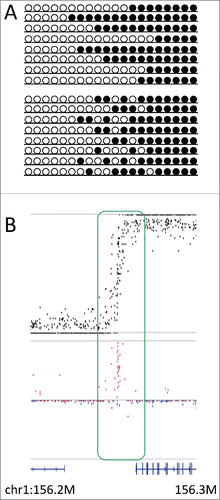
Figure 5. Changes in D during epigenetic reprogramming. (A) Schematic representation of changes in allelic methylation patterns during epigenetic reprogramming from erased (upper panel) to reprogrammed (lower panel). Middle panels show 2 models explaining allelic heterogeneity at the time of reprogramming, i.e., the mixture of fully methylated and unmethylated alleles or the spatially interspersed methylation patterns in all alleles. (B) Plots showing methylation level and D at the genomic region chr1:165,490,000 –166,000,000 in male primordial germ cells at embryonic days 13.5 and 16.5 and sperms. In 13.5 day germ cells, methylation is erased, while in sperms, reprogramming is completed. In 16.5 day germ cells, when methylation levels showed intermediate values, D tended to show positive values, thereby supporting the latter hypothesis. Bottom track shows the gene annotation.
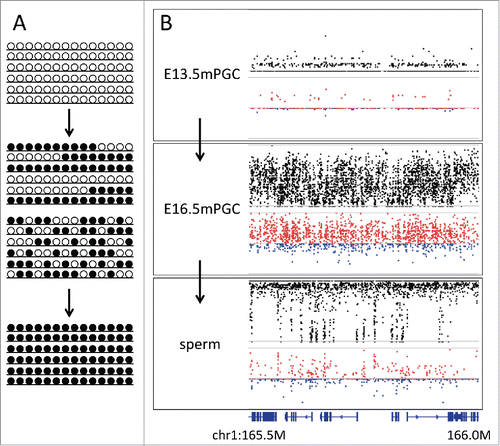
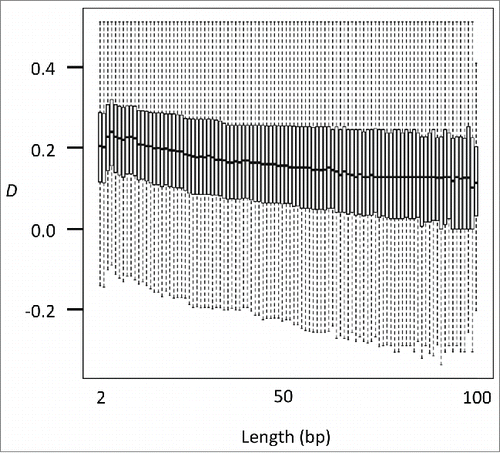
Figure 6. D depends on the length of the CpG pair. Box plots show the relationship between the length of the CpG pair and D at an intermediate methylation level (0.25–0.75) in male primordial germ cells (embryonic day 16.5).