Figures & data
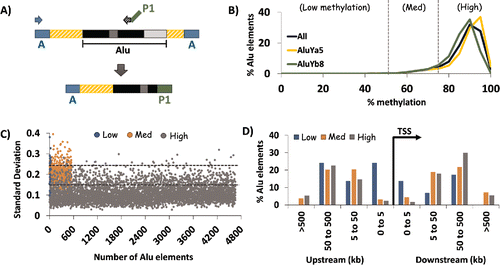
Figure 1. HT-TREBS of AluYa5 and AluYb8 in human fibroblast cells. (A) Primer scheme depicting the enrichment of AluYa5 and AluYb8 sequences using HT-TREBS. Briefly, methylated Ion Torrent “A” adaptors were ligated to sheared and size-selected genomic DNA, and the sample was bisulfite-treated. Ion “A” primers and subfamily-specific primers (with Ion “P1” adaptor on their 5′ ends) amplified fragments containing part of the Alu element (the first monomer and middle A-rich region) along with some flanking genomic sequence. (B) Methylation profile for AluYa5 and AluYb8 elements, binned in increments of 5%, for the 5238 loci sequenced. Loci were subdivided into 3 broad groups roughly corresponding to the inflection points in the graph: Low (0–50%), Medium (50–75%) and High methylation (75-100%). (C) Characterization of loci in terms of variation in methylation level (expressed in standard deviation, SD) for the 3 methylation groups. Dashed horizontal lines represent the thresholds used in the analysis (SD 0.15 and 0.25). Variation in DNA methylation was generally observed to be lower for highly methylated elements compared with those in the medium and low methylation groups. (D) Distance of AluYa5 andYb8 elements to the nearest transcription start site (TSS) based on methylation level. Alu elements with low levels of methylation appeared more likely to be present close to gene promoters compared with those methylated at >50% levels.

Table 1. Characteristics of AluYa5/Yb8 elements located within 1-kb of the nearest transcription start site (TSS) and their associated gene. Loci were subdivided into three broad groups: Low (0-50%), Medium (50-75%) and High methylation (75-100%). Negative sign (-) indicates that the gene is upstream of the transcription start site (TSS).
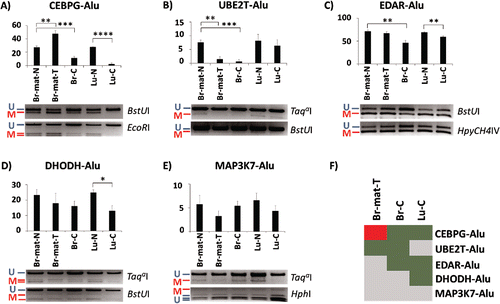
Figure 2. Methylation variation of AluYa5 and Yb8 loci closely associated with a gene in normal and cancer samples. Alu elements are named after their associated gene. (A-E) Methylation levels are quantified through COBRA, followed by densitometry, in 5 tissues: matched breast normal (Br-mat-N); matched breast primary tumor (Br-mat-T); breast cancer (Br-C); normal lung (Lu-N); and lung cancer (Lu-C). Bands are labeled as either methylated (red “M”) or unmethylated (blue “U”), along with the appropriate restriction enzyme. * P < 0.05; ** P ≤ 0.01; *** P ≤ 0.001; **** P ≤ 0.0001. Error bars indicate standard error of mean (SEM). (F) Relative to the appropriate control, CEBPG-Alu, UBE2T-Alu, EDAR-Alu and DHODH-Alu showed significant difference in methylation in at least one test sample. Heatmap summarizes the results as hypermethylation (red), hypomethylation (green), and no significant change (gray).

Figure 3. Methylation variation of CEBPG-Alu in normal and cancer samples. (A) Heatmaps show the methylation patterns of the CEBPG-Alu locus (after nested PCR) in the 5 samples described in . Red and blue in the heatmap indicate methylated and unmethylated CpG sites, whereas white marks CpG sites with unknown methylation status. CpG sites within actual Alu elements are enclosed by black rectangles. The % methylation is shown for the entire amplicon (top) as well as for CpG sites within vs. flanking the AluYa5 element (bottom). Significant differences (P < 0.0001) are shown with a large asterisk. Arrowheads indicate the A-box (gray) and B-box (purple) in the Alu element [top], and CpG sites analyzed by COBRA (BstUI, green; HpyCH4III, orange) [bottom]. (B) Methylation levels of a few pertinent CpG sites within the locus (marked by the arrowheads) in the 5 samples.
![Figure 3. Methylation variation of CEBPG-Alu in normal and cancer samples. (A) Heatmaps show the methylation patterns of the CEBPG-Alu locus (after nested PCR) in the 5 samples described in Fig. 2. Red and blue in the heatmap indicate methylated and unmethylated CpG sites, whereas white marks CpG sites with unknown methylation status. CpG sites within actual Alu elements are enclosed by black rectangles. The % methylation is shown for the entire amplicon (top) as well as for CpG sites within vs. flanking the AluYa5 element (bottom). Significant differences (P < 0.0001) are shown with a large asterisk. Arrowheads indicate the A-box (gray) and B-box (purple) in the Alu element [top], and CpG sites analyzed by COBRA (BstUI, green; HpyCH4III, orange) [bottom]. (B) Methylation levels of a few pertinent CpG sites within the locus (marked by the arrowheads) in the 5 samples.](/cms/asset/4f486447-6023-46b3-8694-85acebafeafe/kepi_a_1130518_f0003_oc.gif)
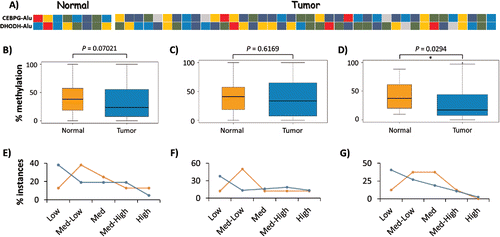
Figure 4. Interindividual variation in DNA methylation of AluYa5 and Yb8. (A) Heatmap showing the average methylation level of CEBPG-Alu and DHODH-Alu in 8 normal and 40 breast tumor samples as determined by the COBRA assay: dark blue, 0–20% methylation (Low); blue, 20–40% (Medium-Low); green, 40–60% (Medium); gold, 60–80% (Medium-High); and red, 80–100% (High). (B-G) Variation in methylation levels for CEBPG-Alu in normal vs. tumor samples for CpG sites recognized by: both BstUI and HpyCH4III (B, E); BstUI only (C, F); and, HpyCH4III only (D, G). Panels B-D represent statistical analyses of data from all samples as pooled into normal vs. tumor, with significant hypomethylation only at the HpyCH4III site; Panels E-G depict the relative numbers of samples in each group as pooled into 5 levels of variation in methylation, with more tumor samples methylated at Low (0–20%) levels at all tested CpG sites.

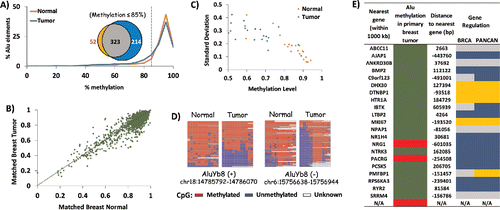
Figure 5. Tumorigenesis-related variation in DNA methylation of AluYb8. HT-TREBS analysis of matched breast normal and primary tumor tissues showing tumorigenesis-related variations in DNA methylation of AluYb8 elements. (A) Methylation profile of the normal (orange) and tumor (blue) samples, based on the percent Alu elements belonging to methylation bins in increments of 5%. The venn-diagram (inset) shows the 4X higher number of hypomethylated loci (<85% methylation; dotted line) in the tumor (blue) compared to the normal tissue (orange). (B) Methylation level of individual Alu loci in the matched breast tumor vs. normal, with each dot representing one Alu locus. Most loci follow the y = x dotted line, indicating no major difference in methylation between the 2 tissues. (C) Variation in methylation (standard deviation) vs. methylation level of the 22 differentially methylated AluYb8 loci, indicating lower methylation and higher levels of variation in the tumor tissue (blue) compared to the normal tissue (orange). (D) Heatmaps showing methylation levels of 2 AluYb8 loci in normal and tumor tissues. (E) Summary of information with respect to the nearest gene associated with the 22 differentially methylated AluYb8 loci (green for hypomethylation and red for hypermethylation). Negative sign (−) indicates that the gene is upstream of the Alu element; “N/A” indicates no gene within 1000 kb of the Alu element. Gene regulation information is from the invasive breast cancer (BRCA) and Pan-Cancer (PANCAN) data sets from TCGA; using Student t-test (P <0.05), genes were classified as downregulated (blue) or upregulated (gold). Gray indicates no significant change.

