Figures & data
Table 1. Summary of sequence alignment and duplicate rates for 7 buccal epithelium samples from MC Seq.
Figure 1. Analysis of MC Seq data. a – CpG content distribution of CpGs (island, shore, shelf, and open sea). Height of bar graphs represent number of CpGs covered by MC Seq, where dark, medium and light blue bars represent maximum possible within 200 bases of target region list, maximum possible within target region list and observed CpGs (for one sample), respectively. b – Functional genomic distribution of CpGs (promoter, 5′-UTR, exon, intron, 3′-UTR, TTS, and intergenic). Height of bar graphs represent number of CpGs covered by MC Seq, where dark, medium and light blue bars represent maximum possible within 200 bases of target region list, maximum possible (within target region list) and observed CpGs (for one sample), respectively. c – Chromosome distribution of CpGs for all 7 buccal samples. Height of bar graphs show number of CpGs detected at each chromosome normalized by number of CpGs on the chromosome in human epigenome (hg19). Male sample M7_Chi shows a peak in normalized number of CpGs detected on Y chromosome. d – Pie chart showing number and percentage of methylation sites detected within CpG, CHG, and CHH context for one sample. e – Pearson correlation and scatterplot of methylation values from MC Seq for replicate 1 (horizontal axis) and replicate 2 (vertical axis) for one sample. Color represents density of CpG sites, with darker blue indicating higher density of CpG sites and lighter blue indicating lower density of CpG sites. Five hundred randomly selected CpG sites are shown as black points. Dotted line gives y=x line, solid line gives best-fit line; overlapping lines indicate high concordance between replicates. f – Cumulative percentage of probes (vertical axis) vs. absolute difference in methylation between replicates (horizontal axis), at ≥10X (solid line), ≥30X (dashed line), ≥50X (dotted line) and ≥70X (dotted-dashed line) reads coverage, for one sample. g – Hierarchical clustering analysis of replicates show that replicates cluster together. Corresponding plots for a-b and d-g for other samples are provided in Supplementary Figs. 1–5.
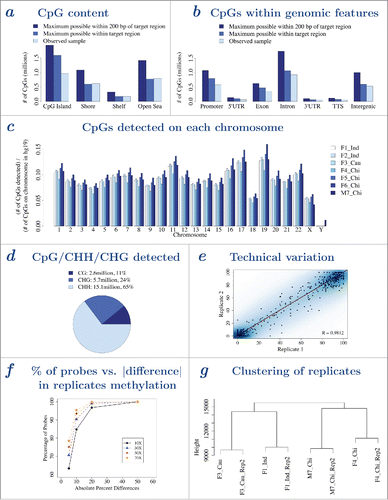
Figure 2. Performance of MC Seq at 3 μg and 1 μg were similar. a – Pearson correlation and scatterplot of methylation values from MC Seq at 3 μg (horizontal axis) and 1 μg (vertical axis) for one sample. Color represents density of CpG sites, with darker blue indicating higher density of CpG sites and lighter blue indicating lower density of CpG sites. Five hundred randomly selected CpG sites are shown as black points. Dotted line gives y=x line, solid line gives best-fit line; overlapping lines indicate high concordance at 3 μg and 1 μg. b – Cumulative percentage of probes (vertical axis) vs. absolute difference in methylation between 3 μg and 1 μg (horizontal axis), at ≥10X (solid line), ≥30X (dashed line), ≥50X (dotted line) and ≥70X (dotted-dashed line) reads coverage, for one sample. c – Hierarchical clustering analysis shows that corresponding samples at 3 μg and 1 μg cluster together. Corresponding plots for a-b for other samples are provided in Supplementary Figs. 6–7.
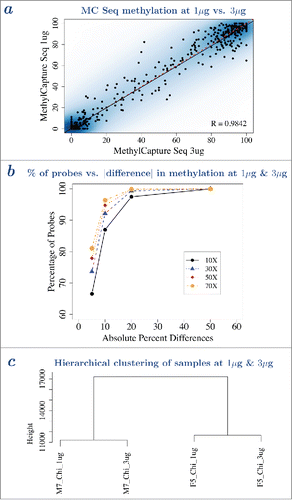
Table 2. Comparison of performance of MC Seq using 1 μg and 3 μg of genomic DNA. First two columns give number of CpGs observed at 1 μg and 3 μg, third column gives the number of common CpGs observed at both. Last two columns give the correlation between methylation values at 1 μg and 3 μg.
Figure 3. Methylation values from MC Seq and Infinium 450K were highly correlated and both gave a bimodal distribution. a – Observed number of CpGs (vertical axis) from MC Seq for one sample at different MC Seq reads coverage (horizontal axis). As reads coverage increases (left to right), number of CpGs decreases (top to bottom). b – Pearson correlation (vertical axis) between methylation values from MC Seq and Infinium 450K at the same CpG sites, at different MC Seq reads coverage (horizontal axis) for one sample. As reads coverage increases (left to right), Pearson correlation increases (bottom to top). c – Scatterplot of methylation values from MC Seq (≥10X, vertical axis) and Infinium 450K (horizontal axis) at the same CpG sites for one sample. Color represents density of CpG sites, with darker blue indicating higher density of CpG sites and lighter blue indicating lower density of CpG sites. Five hundred randomly selected CpG sites are shown as black points. Dotted line gives y=x line, solid line gives best-fit line; parallel lines indicate high correlation between methylation values from the 2 platforms; slight vertical shift indicates a small systematic bias. d – Cumulative percentage of probes (vertical axis) vs. absolute difference in methylation between MC Seq and Infinium 450K (horizontal axis), at ≥10X (solid line), ≥30X (dashed line), ≥50X (dotted line) and ≥70X (dotted-dashed line) reads coverage, for one sample. e – Distribution of methylation values for all CpGs from MC Seq (≥10X, solid line) and Infinium 450K (dotted line) for one sample. f – Distribution of methylation values for common CpGs from MC Seq (≥10X, solid line) and Infinium 450K (dotted line) for one sample. Corresponding plots for other samples are provided in Supplementary Figs. 9–14.
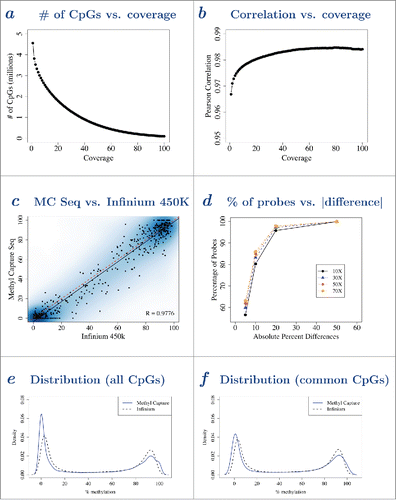
Table 3. Comparison of MC Seq and Infinium 450K.
Figure 4. Hierarchical clustering analysis of methylation values showed clinical samples clustered by ethnicity. a – Hierarchical clustering analysis of all 7 samples profiled using MC Seq, using most variably methylated probes, e.g., probes with interquartile range >20% (autosomal sites). Clustering was performed using Euclidean distance and “ward.D” method in R. b – Hierarchical clustering analysis of all 7 samples profiled using Infinium 450K, using most variably methylated probes, e.g., probes with interquartile range >20% (autosomal and non cross-reactive sites). Clustering was performed using Euclidean distance and “ward.D” method in R. Hierarchical clustering analysis using other distance metrics and agglomeration methods, are reported with their approximately unbiased p-values, in Supplementary Figs. 15–16.
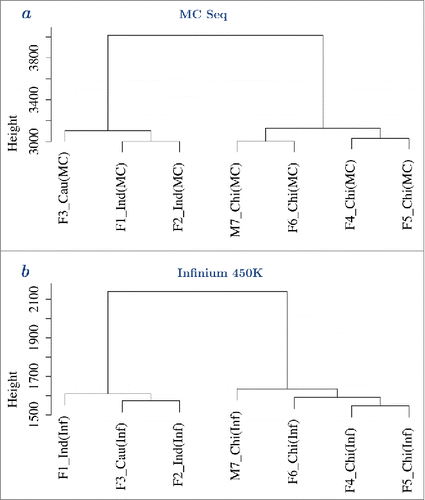
Figure 5. MC Seq provides denser coverage of the epigenome. a – Genomic coverage (percentage covered) of unique genes (promoter, 5′-UTR, exon, intron, 3′-UTR, TTS, and intergenic regions) by Infinium 450K (dark blue), MC Seq, maximum possible (medium blue), and MC Seq, observed for one sample at >=10X (light blue), respectively. b – CpG coverage (percentage covered) of CpG islands, shores, and shelves, by Infinium 450K (dark blue), MC Seq, maximum possible (medium blue), and MC Seq, observed for one sample at >=10X (light blue), respectively. Corresponding plots for other samples are provided in Supplementary Figs. 19–20.
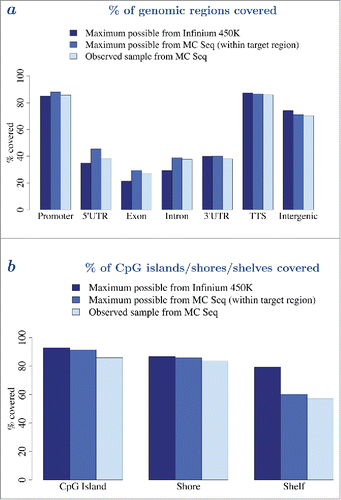
Figure 6. MC Seq provides denser coverage of the epigenome. Genomic coverage (density of coverage) of unique genes (promoter, 5′-UTR, exon, and 3′-UTR) by Infinium 450K (first column), MC Seq, maximum possible (second column), MC Seq, observed for one sample at ≥10X (third column), and MC Seq, observed for one sample at ≥30X (fourth column), respectively. Density of coverage for remaining regions (intron, TTS, and intergenic regions; CpG islands, shores, and shelves) are provided in Supplementary Figs. 21–22.
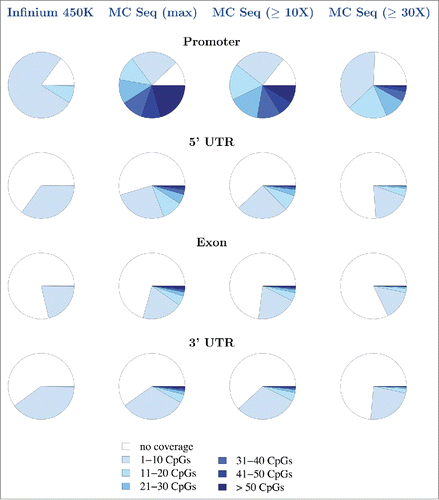
Table 4. Summary of CpGs detected by MC Seq and Infinium 450K.
