1,702
Views
23
CrossRef citations to date
0
Altmetric
Research Paper

Gene promoter methylation signature predicts survival of head and neck squamous cell carcinoma patients

, , , , , , , , , , , , , , , & show all
Pages 61-73 | Received 02 Dec 2015, Accepted 24 Dec 2015, Published online: 22 Feb 2016

Figures & data

Figure 1. Schematic representation of the study design and association between the MS, the MMSS and the survival status of HNSCC patients. (A) The MS was evaluated based on quantitative MassARRAY data of 62 CpG units in proximal promoters of ALDH1A2, OSR2, IRX4, GRIA4 and GATA4 as described previously Citation25, and revealed informative data for 220 patients of the HNSCC cohort (n = 54 OPSCC and n = 166 non-OPSCC). The MMSS was established as a less complex signature, consisting of the 10 most informative CpG units in proximal promoters of ALDH1A2, OSR2, IRX4 and GRIA4, with data of the training cohort (n = 100; Citation25), and was applied on patients of the HNSCC cohort (n = 295 with n = 80 OPSCC and n = 215 non-OPSCC). Univariate and multivariate survival analysis was conducted to confirm prognostic effects of MS and MMSS. (B) Heatmap summarizing the MS, the MMSS and the survival status of HNSCC patients. Each column indicates a patient of the HNSCC cohort (n = 220) and the methylation status according to the established pattern ALDH1A2low, OSR2low, GATA4high, GRIA4high, IRX4high for favorable prognosis is indicated in black (congruent) or white (non-congruent). The colored bars indicate the final value for MS and the MMSS is depicted in blue (MMSS_p) or gray (MMSS_g). The survival status is indicated in gray (alive) or black (dead).
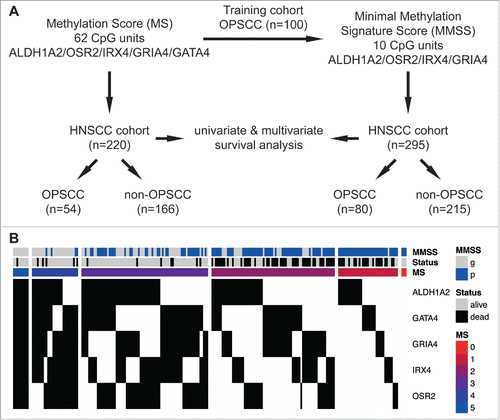
Figure 1. Schematic representation of the study design and association between the MS, the MMSS and the survival status of HNSCC patients. (A) The MS was evaluated based on quantitative MassARRAY data of 62 CpG units in proximal promoters of ALDH1A2, OSR2, IRX4, GRIA4 and GATA4 as described previously Citation25, and revealed informative data for 220 patients of the HNSCC cohort (n = 54 OPSCC and n = 166 non-OPSCC). The MMSS was established as a less complex signature, consisting of the 10 most informative CpG units in proximal promoters of ALDH1A2, OSR2, IRX4 and GRIA4, with data of the training cohort (n = 100; Citation25), and was applied on patients of the HNSCC cohort (n = 295 with n = 80 OPSCC and n = 215 non-OPSCC). Univariate and multivariate survival analysis was conducted to confirm prognostic effects of MS and MMSS. (B) Heatmap summarizing the MS, the MMSS and the survival status of HNSCC patients. Each column indicates a patient of the HNSCC cohort (n = 220) and the methylation status according to the established pattern ALDH1A2low, OSR2low, GATA4high, GRIA4high, IRX4high for favorable prognosis is indicated in black (congruent) or white (non-congruent). The colored bars indicate the final value for MS and the MMSS is depicted in blue (MMSS_p) or gray (MMSS_g). The survival status is indicated in gray (alive) or black (dead).

Figure 2. A high MS serves as prognostic biomarker for favorable survival in a HNSCC cohort. Kaplan-Meier plots demonstrate an improved survival of the MS3-5 (black line) as compared to the MS0-2 subgroup (red line), which is highly significant for all HNSSC patient (n = 220, A), as well as for the subgroup of patients with either OPSCC (n = 54, B) or non-OPSCC (n = 166, C). (D) The Forest plot displays the relative strength of prognostic effects as HR and 95% CI according to the methylation subgroup (MS0-2 vs. MS3-5) on disease-specific survival for all HNSCC (n = 220), and subgroup of patients with OPSCC (n = 54), non-OPSCC (n = 166), hypopharyngeal (n = 30), laryngeal (n = 69) and oral SCC (n = 63).
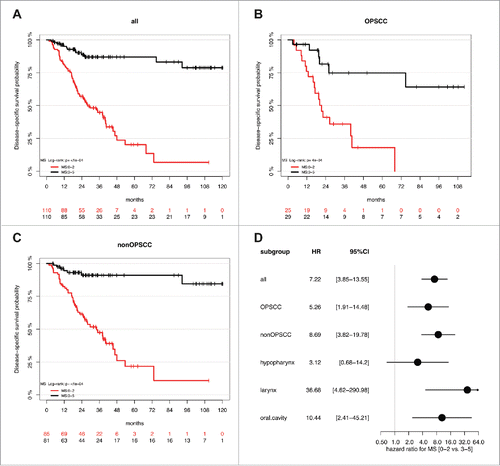
Figure 2. A high MS serves as prognostic biomarker for favorable survival in a HNSCC cohort. Kaplan-Meier plots demonstrate an improved survival of the MS3-5 (black line) as compared to the MS0-2 subgroup (red line), which is highly significant for all HNSSC patient (n = 220, A), as well as for the subgroup of patients with either OPSCC (n = 54, B) or non-OPSCC (n = 166, C). (D) The Forest plot displays the relative strength of prognostic effects as HR and 95% CI according to the methylation subgroup (MS0-2 vs. MS3-5) on disease-specific survival for all HNSCC (n = 220), and subgroup of patients with OPSCC (n = 54), non-OPSCC (n = 166), hypopharyngeal (n = 30), laryngeal (n = 69) and oral SCC (n = 63).

Table 1. Multivariate Cox regression model analysis for the MS (n = 211).

Figure 3. The MMSS_g serves as prognostic biomarker for favorable survival in a HNSCC cohort. Kaplan-Meier plots demonstrate an improved survival of the MMSS_g (black line) as compared to the MMSS_p subgroup (red line), which is highly significant for all HNSSC patient (n = 295, A), as well as for the subgroup of patients with non-OPSCC (n = 215, C). (D) The Forest plot displays the relative strength of the prognostic effects as HR and 95% CI according to the methylation subgroup (MMSS_p vs. MMSS_g) on disease-specific survival for all HNSCC (n = 295), and subgroup of patients with OPSCC (n = 80), non-OPSCC (n = 215), hypopharyngeal (n = 37), laryngeal (n = 93) and oral SCC (n = 80).
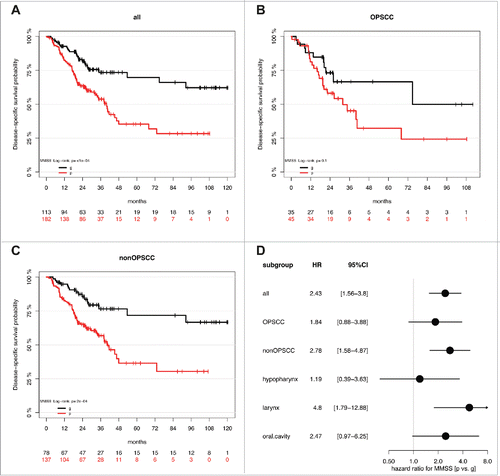
Figure 3. The MMSS_g serves as prognostic biomarker for favorable survival in a HNSCC cohort. Kaplan-Meier plots demonstrate an improved survival of the MMSS_g (black line) as compared to the MMSS_p subgroup (red line), which is highly significant for all HNSSC patient (n = 295, A), as well as for the subgroup of patients with non-OPSCC (n = 215, C). (D) The Forest plot displays the relative strength of the prognostic effects as HR and 95% CI according to the methylation subgroup (MMSS_p vs. MMSS_g) on disease-specific survival for all HNSCC (n = 295), and subgroup of patients with OPSCC (n = 80), non-OPSCC (n = 215), hypopharyngeal (n = 37), laryngeal (n = 93) and oral SCC (n = 80).

Table 2. Multivariate Cox regression model analysis for the MMSS (n = 286).

Figure 4. The MMSS reliably predicts survival of HNSCC patients with a missing MS. (A) Comparative analysis of MS and MMSS values for all HNSCC patients (n = 220) for which data for both methylation scores were available. (B) The Kaplan-Meier plot demonstrates the prognostic value of the MMSS_g to predict improved survival of HNSCC patient with available MS (n = 89, green line) as well as those with a missing MS (n = 24, black line). The MMSS_p is associated with an unfavorable survival, which is displayed for HNSCC patients with an available MS (blue line) and those with a missing MS (red line).
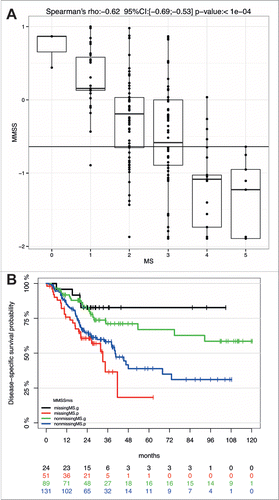
Figure 4. The MMSS reliably predicts survival of HNSCC patients with a missing MS. (A) Comparative analysis of MS and MMSS values for all HNSCC patients (n = 220) for which data for both methylation scores were available. (B) The Kaplan-Meier plot demonstrates the prognostic value of the MMSS_g to predict improved survival of HNSCC patient with available MS (n = 89, green line) as well as those with a missing MS (n = 24, black line). The MMSS_p is associated with an unfavorable survival, which is displayed for HNSCC patients with an available MS (blue line) and those with a missing MS (red line).
Supplemental material

Supplementary_Datas.zip

Download Zip (1.6 MB)

Reprints and Corporate Permissions

Please note: Selecting permissions does not provide access to the full text of the article, please see our help page How do I view content?

To request a reprint or corporate permissions for this article, please click on the relevant link below:

Academic Permissions

Please note: Selecting permissions does not provide access to the full text of the article, please see our help page How do I view content?

Obtain permissions instantly via Rightslink by clicking on the button below:

If you are unable to obtain permissions via Rightslink, please complete and submit this Permissions form. For more information, please visit our Permissions help page.