3,332
Views
70
CrossRef citations to date
0
Altmetric
Research Paper

Gestational stress induces depressive-like and anxiety-like phenotypes through epigenetic regulation of BDNF expression in offspring hippocampus

, , &
Pages 150-162 | Received 28 Oct 2015, Accepted 19 Jan 2016, Published online: 22 Mar 2016

Figures & data

Figure 1. Gestational stress induced depressive-like and anxiety-like behaviors in young adult offspring. In the forced swimming test, immobility (A), swimming (B) and struggling (C) behaviors were analyzed during a 5-minute test. In the tail suspension test, immobility (D) was recorded during a 5-minute test. In the sucrose consumption test, the sucrose preference (E) was calculated as percentage of consumed sucrose solution over total liquid intake (F) for 24. h In the elevated plus maze test, percentage of open arm entries (G) and percentage of time spent in open arms (H) were scored for a 10-minute test. Data are presented as mean ± SEM; n = 10 for each group; *P < 0 .05 (Student t-test) vs. no-stress offspring.
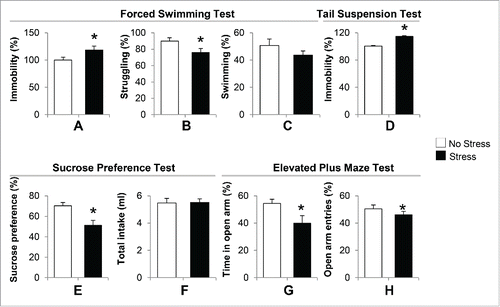
Figure 1. Gestational stress induced depressive-like and anxiety-like behaviors in young adult offspring. In the forced swimming test, immobility (A), swimming (B) and struggling (C) behaviors were analyzed during a 5-minute test. In the tail suspension test, immobility (D) was recorded during a 5-minute test. In the sucrose consumption test, the sucrose preference (E) was calculated as percentage of consumed sucrose solution over total liquid intake (F) for 24. h In the elevated plus maze test, percentage of open arm entries (G) and percentage of time spent in open arms (H) were scored for a 10-minute test. Data are presented as mean ± SEM; n = 10 for each group; *P < 0 .05 (Student t-test) vs. no-stress offspring.

Figure 2. Gestational stress changes the expression of brain-derived neurotrophic factor (BDNF) transcripts in the hippocampus of young adult offspring. Among seven BDNF variants tested, BDNF transcripts (-i, -iv, -vi, and -ix) (A) and protein expression (B) in the hippocampus of gestational-stress offspring are significantly decreased compared to the non-stress offspring. Data are presented as mean ± SEM of 10 mice for each group. *P < 0.05 (one-way ANOVA followed by Bonferroni test vs. the corresponding value for non-stress offspring).

Figure 2. Gestational stress changes the expression of brain-derived neurotrophic factor (BDNF) transcripts in the hippocampus of young adult offspring. Among seven BDNF variants tested, BDNF transcripts (-i, -iv, -vi, and -ix) (A) and protein expression (B) in the hippocampus of gestational-stress offspring are significantly decreased compared to the non-stress offspring. Data are presented as mean ± SEM of 10 mice for each group. *P < 0.05 (one-way ANOVA followed by Bonferroni test vs. the corresponding value for non-stress offspring).

Figure 3. Gestational stress significantly increases expression of DNMT1 mRNA (A) and protein (B) in the hippocampus of gestational-stress offspring. The representative immunoblots show a major band of approximately 190 kDa for DNMT1. All values are means ± SEM of 8 mice for each group. * P < 0.05 (Student t-test) vs. the corresponding control values. (C) Gestational stress significantly increases the levels of 5-methylcytosine (5mC) on promoter regions (-i, -iv, -vi and -ix) in the hippocampus of offspring compared to non-stress offspring. Data are presented as mean ± SEM of 10 mice for each group. * P < 0.05 (one-way ANOVA followed by Bonferroni test vs. the corresponding values for non-stress offspring).
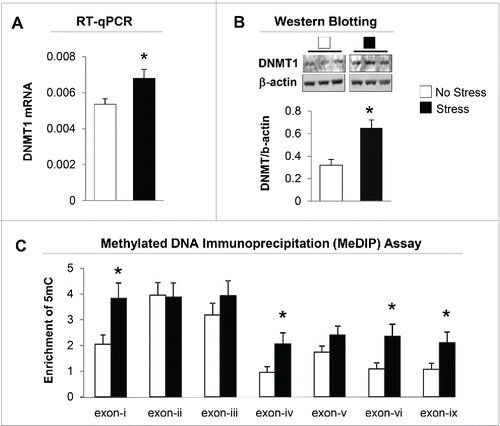
Figure 3. Gestational stress significantly increases expression of DNMT1 mRNA (A) and protein (B) in the hippocampus of gestational-stress offspring. The representative immunoblots show a major band of approximately 190 kDa for DNMT1. All values are means ± SEM of 8 mice for each group. * P < 0.05 (Student t-test) vs. the corresponding control values. (C) Gestational stress significantly increases the levels of 5-methylcytosine (5mC) on promoter regions (-i, -iv, -vi and -ix) in the hippocampus of offspring compared to non-stress offspring. Data are presented as mean ± SEM of 10 mice for each group. * P < 0.05 (one-way ANOVA followed by Bonferroni test vs. the corresponding values for non-stress offspring).

Figure 4. The enrichment of 5mC (promoter methylation) on exons of BDNF-i (A), -iv (B), -vi (C), and -ix (D) is negatively correlated with the corresponding transcripts by Pearson correlation analysis.

Figure 4. The enrichment of 5mC (promoter methylation) on exons of BDNF-i (A), -iv (B), -vi (C), and -ix (D) is negatively correlated with the corresponding transcripts by Pearson correlation analysis.

Figure 5. Gestational stress induces alteration of hippocampal HDACs expression in offspring. (A) The mRNA of HDAC1 and HDAC2 but not HDAC3 are significantly increased in the hippocampus of gestational-stress offspring as compared to non-stress offspring. (B) Immunoblot data normalized by β-actin protein levels show a marked increase in the protein levels of HDAC1 and HDAC2 but not HDAC3 in the hippocampus of gestational-stress mice compared to non-stress offspring. Data are presented as mean ± SEM of 10 mice for each group. *P < 0.05 (one-way ANOVA followed by Bonferroni test vs. the corresponding values for non-stress offspring).

Figure 5. Gestational stress induces alteration of hippocampal HDACs expression in offspring. (A) The mRNA of HDAC1 and HDAC2 but not HDAC3 are significantly increased in the hippocampus of gestational-stress offspring as compared to non-stress offspring. (B) Immunoblot data normalized by β-actin protein levels show a marked increase in the protein levels of HDAC1 and HDAC2 but not HDAC3 in the hippocampus of gestational-stress mice compared to non-stress offspring. Data are presented as mean ± SEM of 10 mice for each group. *P < 0.05 (one-way ANOVA followed by Bonferroni test vs. the corresponding values for non-stress offspring).

Figure 6. Immunoblot analysis shows a decrease in the protein level of AcH3K14 in the hippocampus of gestational-stress offspring. Data are presented as mean ± SEM of 10 mice for each group. * P < 0.05 (Student t-test) vs. non-stress offspring.

Figure 6. Immunoblot analysis shows a decrease in the protein level of AcH3K14 in the hippocampus of gestational-stress offspring. Data are presented as mean ± SEM of 10 mice for each group. * P < 0.05 (Student t-test) vs. non-stress offspring.

Figure 7. Gestational stress causes decrease of AcH3K14 binding to BDNF exons (-i, -iv, -vi and -ix) in the hippocampus compared to non-stress offspring. Data are presented as mean ± SEM of 10 mice for each group. * P < 0.05 (One-way ANOVA followed by Bonferroni test vs. corresponding values for non-stress offspring for ChIP assay). IP: immunoprecipitation.

Figure 7. Gestational stress causes decrease of AcH3K14 binding to BDNF exons (-i, -iv, -vi and -ix) in the hippocampus compared to non-stress offspring. Data are presented as mean ± SEM of 10 mice for each group. * P < 0.05 (One-way ANOVA followed by Bonferroni test vs. corresponding values for non-stress offspring for ChIP assay). IP: immunoprecipitation.

Table 1. Correlation analysis for selected biological and behavioral measures.

Supplemental material

KEPI_A_1146850_s02.doc

Download MS Word (51 KB)

Reprints and Corporate Permissions

Please note: Selecting permissions does not provide access to the full text of the article, please see our help page How do I view content?

To request a reprint or corporate permissions for this article, please click on the relevant link below:

Academic Permissions

Please note: Selecting permissions does not provide access to the full text of the article, please see our help page How do I view content?

Obtain permissions instantly via Rightslink by clicking on the button below:

If you are unable to obtain permissions via Rightslink, please complete and submit this Permissions form. For more information, please visit our Permissions help page.