
Figures & data
Figure 1. Filtering criteria for the identification of CpGs differentially methylated between GDM and normal pregnancies. The starting number of CpGs (484,273) was derived through the removal of CpGs with high detection values (P > 0.05) and those with missing β-values in any one of the 22 samples, as described in the Materials and Methods. Horizontal line denotes additional filtering steps. *According to Finer et al. criteria.Citation22 **According to Ruchat et al. criteria.Citation17 GDM, gestational diabetes. SD, standard deviation.
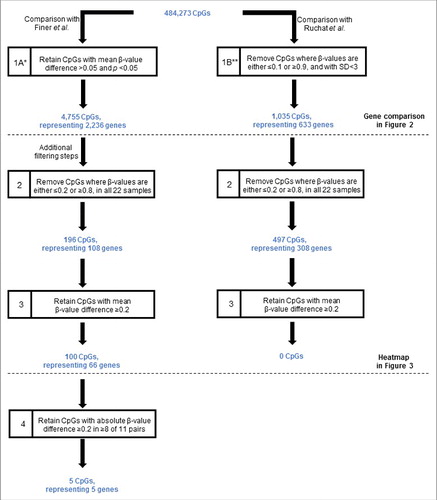
Figure 2. Venn diagrams illustrating comparison of genes differentially methylated in GDM using maternal blood with those identified in cord blood and placenta of GDM affected pregnancies from the cohorts of (A) Finer et al.Citation22 and (B) Ruchat et al.Citation17, respectively. The genes from our dataset that were common with the other study are shown in dark gray shading. Genes identified as differentially methylated in Finer et al.Citation22 were obtained from Supplementary file 2 of the published article, while the list of differentially methylated genes identified by Ruchat et al.Citation17 was kindly provided through personal communication with the corresponding author of Ruchat et al.Citation17
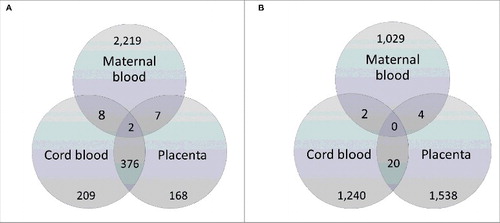
Figure 3. Heatmap and dendrograms showing clusteringCitation45 for the 100 CpGs identified as differentially methylated (mean difference in β-values >0.2) between GDM and healthy pregnancies. DNA methylation across the 100 sites in each of the samples was analyzed by hierarchical clustering using the Euclidean distance and average linkage criteria. Each row represents an individual CpG site and each column a different sample. Healthy controls and GDM samples are shown by the green and red bars, respectively. Slide type is also shown with slide 1 in green and slide 2 in red. Color gradation from yellow to blue represents low to high DNA methylation respectively, with β-values ranging from 0 (no methylation; yellow) to 1 (complete methylation; blue). GDM, gestational diabetes.
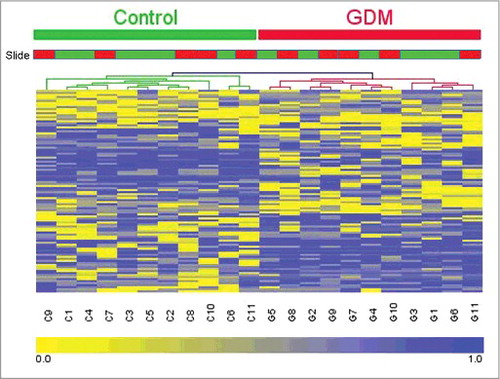
Table 1. Annotation for the 5 genes differentially methylated in 8 of 11 matched pairs, as determined by genome-wide DNA methylation analysis. *The official gene symbol, gene name and stated function were retrieved from the NCBI Gene database (accessed September 2015). **The absolute β-value difference range is the minimum to the maximum value of the individual absolute β-value differences for each differentially methylated CpG.